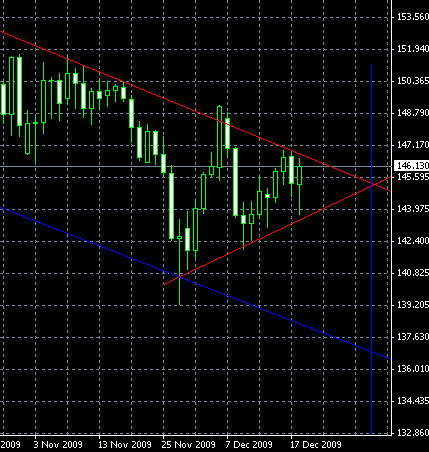
A somewhat rough symmetrical triangles pattern has formed on the D1 timeframe chart of the GBP/JPY currency pair. Considering the general bearish trend on this timeframe period, the pair has an elevated chance of breaking for a downtrend with a target somewhere close to 137.50. A signal would be a close below the lower border of the triangle with a consecutive bounce off this limit (southwards, of course). The bullish breakout is definitely possible too, but I wouldn’t consider such signal, as there is a strong chance of some really freakish fakeout in a bullish side with this pattern. Look at the pattern below and don’t forget to click the image to get a

If you have any questions or comments regarding this GBP/JPY chart pattern, please, feel free to reply via the form below.