
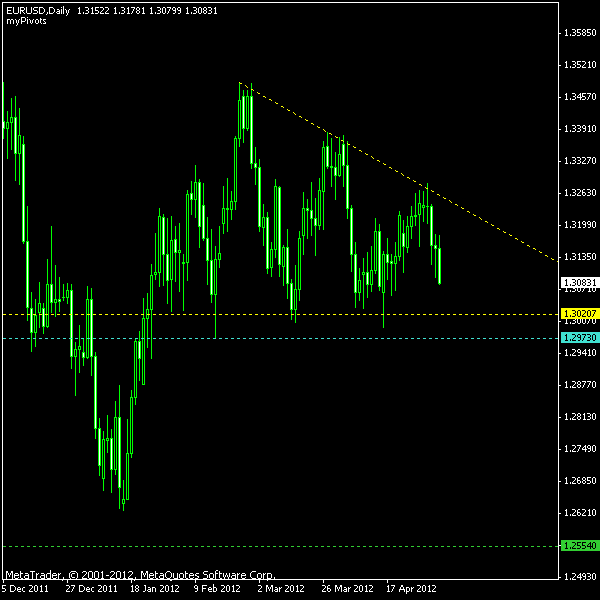
A large descending triangle has formed on the EUR/USD daily chart. Its beginning can be traced back to about February 16. There are three zones where the price touches the upper (sloping) border of the pattern and three zones where it touches the bottom border. Although the triangle is formed at the end of the
You can see the chart pattern on the image below. The yellow lines show the border of the triangle. The cyan line marks the 10% buffer zone for a breakout and entering a sell position. The green line is the target level derived from the height of the triangle.
Update 2012-05-07: Market gapped down and rallied to my entry point and then retreated up significantly. It was too late for setting up the stop orders for entry, so I had to enter short at the market price of 1.3012. The
Update 2012-05-23: The position closed at my initial
If you have any questions or comments regarding this EUR/USD chart pattern, please feel free to reply via the form below.