The euro is giving the Forex traders another nice pattern — this time on EUR/CAD pair, specifically on its daily chart. This is a long-term descending triangle that started forming back in January 2012. Although its upper border is quite rough, there are enough touch-points at both of the triangle’s sides.
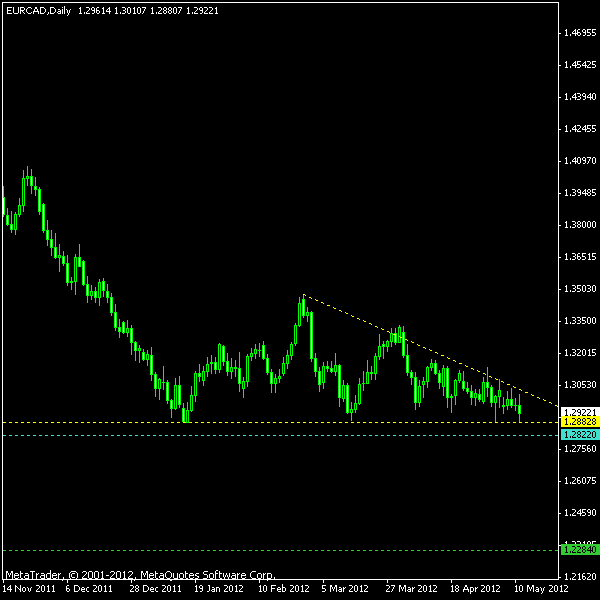
See the image below for the screenshot of this EUR/CAD triangle. The yellow lines show the pattern’s borders. The cyan line at 1.2822 serves as my entry point. The green line placed at 1.2248 rate is for taking profit. Stop-loss is to be placed at the high of the breakout bar. If the breakout bar shows little action inside the triangle’s borders, stop-loss is placed on the high of the preceding bar. The position will also be closed if neither SL nor TP is hit till mid-October. Click on the image below to access a full-sized screenshot of the pattern: Update 2012-05-15: Short position entered at 1.2822 (as planned) with a stop-loss at 1.2936 — the high of the previous trading session. Update 2012-05-17: The trade has hit its stop-loss at 1.2937 (with one pip negative slippage).
If you have any questions or comments regarding this EUR/CAD chart pattern, please feel free to reply via the form below.