- December 21, 2020 Do we get tax benefits on Personal Loan?
- December 18, 2020 The solicitors Preston depends on for stress-free compensation claims
- December 16, 2020 eToro: History and Key Features
- December 11, 2020 Canadian Dollar Pauses 2020 Rally Against US Peer Amid Falling Crude Prices
- December 11, 2020 Pound Crashes Against Dollar As No-Deal Brexit Appears Imminent
- December 11, 2020 USD/JPY 104.57 High Starting a New Bearish Leg?
Day: May 27, 2012
 May 27
2012
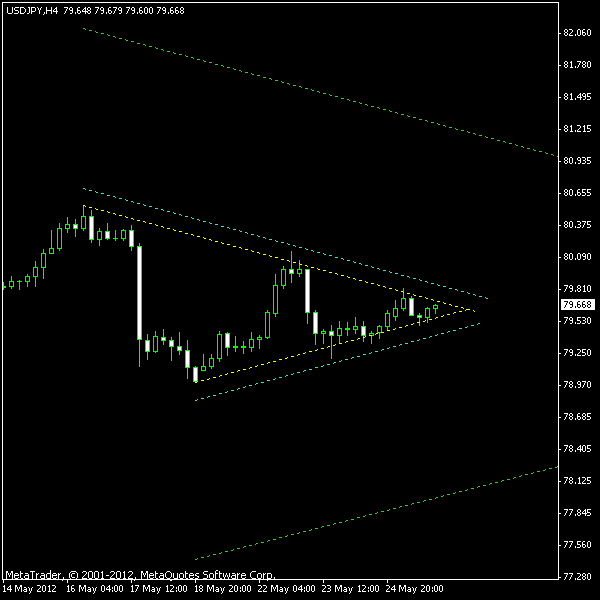
USD/JPY Forms Symmetrical Triangles on H4
USD/JPY has formed an almost ideal symmetrical triangles pattern on its H4 chart. The formation dates back to May 16 and the slopes of the borders are visually identical (in fact, the top border has a bigger slope than the bottom one). Both borders are confirmed by numerous touch-points. The only noticeable flaw in these symmetrical triangles is that the price went inside the pattern almost to the apex, which may render the pattern untradeable. […]
Read more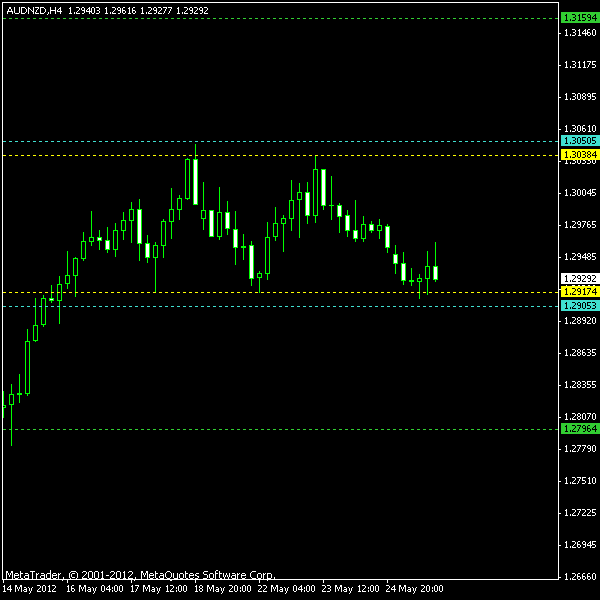 May 27
2012
Double Top on AUD/NZD @ H4
The double top (M-pattern) is now clearly visible on AUD/NZD chart in H4 timeframe. Like the symmetrical triangles on USD/JPY it was forming since May 16. Not many currency traders look into such pairs as AUD/NZD, but this time it seems to be worth it. The pattern may look to be far from perfect — first top is a bit higher than the second and also consists of “sub-tops“, […]
Read more