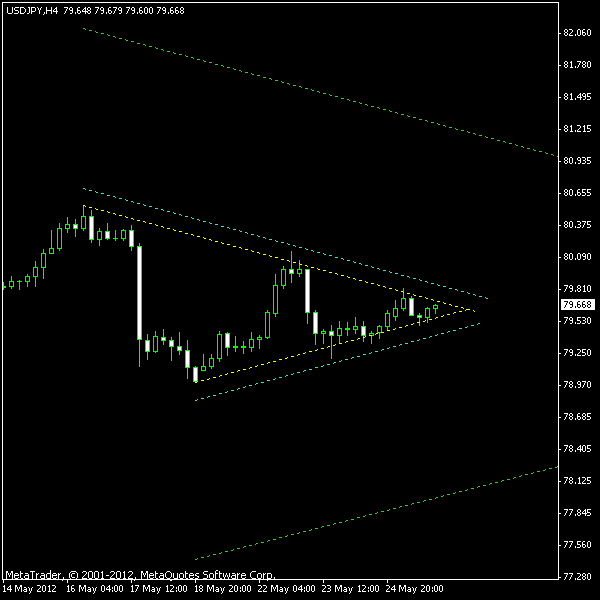
USD/JPY has formed an almost ideal symmetrical triangles pattern on its H4 chart. The formation dates back to May 16 and the slopes of the borders are visually identical (in fact, the top border has a bigger slope than the bottom one). Both borders are confirmed by numerous
The image below depicts the current situation in the USD/JPY currency pair. The yellow lines show the pattern’s borders. The cyan lines will be my entry points in case of a breakout. The current pattern is showing up during the downtrend and is likely to continue it after a bearish breakout. Bullish breakout should be treated with much caution here. The green lines are the profit targets derived from the height of the pattern.

Update 2012-05-28: Short position entered at 79.42 during the first H4 bar of the trading session. The
Update 2012-05-31: Position closed at
If you have any questions or comments regarding this USD/JPY chart pattern, please feel free to reply via the form below.