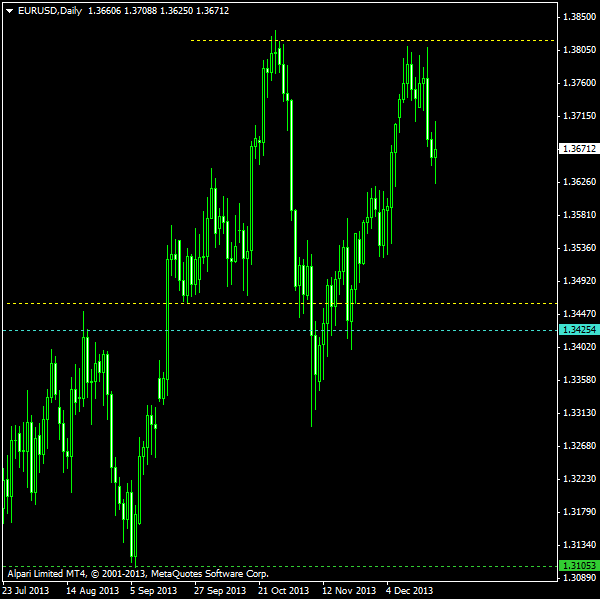
Although the current EUR/USD chart on D1 timeframe does not look like a classic example of a double top formation, it is a valid set-up if you want to trade on a reversal of the medium-term bullish wave that was active since July this year. There are two signs that prevent the current pattern from qualifying as pure double top: first peak is somewhat taller than the second one; the necklines, as I see it, has a breach in it formed between two tops.
I will use trading set-up depicted on the screenshot below. As you can see, the yellow borders delimit the two tops from the upside and a kind of a neckline from the downside. Additional buffer zone is located between the lower yellow line and the cyan entry line. The target, which is exactly 100% of the pattern’s height subtracted from the lower border, coincides with the support level marked by the currency pair at September 6 low. I will use the breakout bar’s high as my stop-loss. I will not trade upper breakout from this pattern. Please click on the image to see a full-sized screenshot:
You can download my MetaTrader 4 chart template for this EUR/USD pattern. I will use my free Chart Pattern Helper EA to trade this pattern. Update 2013-03-03: I have cancelled the pending orders for this pattern. The price action had proved the whole setup wrong — it no longer resembles a double top pattern.
If you have any questions or comments regarding this double top on EUR/USD chart, please feel free to submit them via the form below.