
A small but nonetheless tradeable bullish flag has been spotted on a
The chart below shows the pattern marked with the yellow lines. The same lines form the breakout borders. As this flag is bullish, only an upward breakout will be considered for trading. Entry level is marked with the cyan line located at 10% of the flag’s height (without pole) above the border.
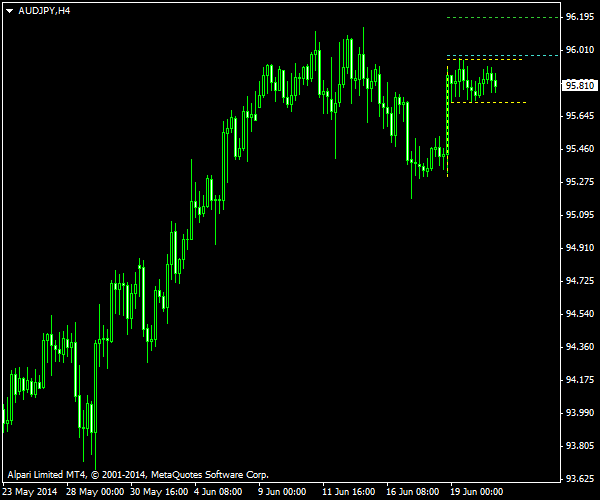
The chart was built using the ChannelPattern script. You can download my MetaTrader 4 chart template for this AUD/JPY pattern. It can be traded using my free Chart Pattern Helper EA.
Update 2014-06-23: The price crossed entry line at about 1:45 GMT today and reached the profit level near the same time too. Unfortunately, the high market volatility and slippage prevented me from taking this otherwise profitable trade. Here is the same chart after the potential trade went off:

If you have any questions or comments regarding this bullish flag on AUD/JPY chart, please feel free to submit them via the form below.