
This week will be another one with a rather strong trading idea at my disposal. The GBP/JPY ascending triangle may look slim, but it is a valid pattern, which was born following an uptrend. It has enough points of contact both with the upper horizontal border and the lower inclined one. The only problem I see is the fact that the formation is only one week long.
The yellow lines mark the triangle itself. The cyan line shows my breakout entry level placed at 10% of the triangle’s height above the border. The green line, located at 100% of the height above the border, will serve me as a
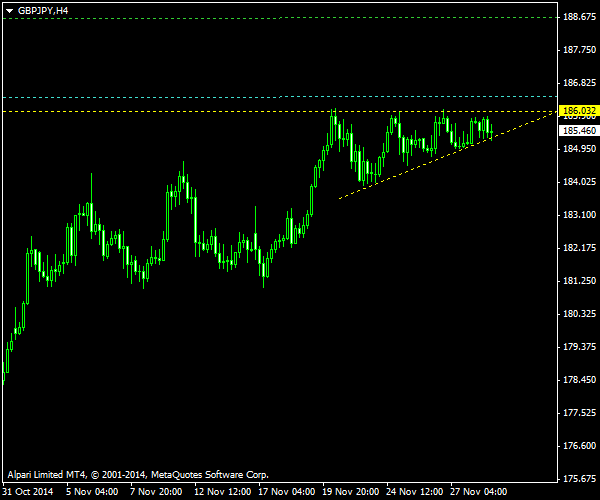
The chart was built using the ChannelPattern script. You can download my MetaTrader 4 chart template for this GBP/JPY pattern. It can be traded using my free Chart Pattern Helper EA.
Update 2014-12-02 13:12 GMT: Long position entered at 186.462 at 6:57 GMT today. The breakout looks OK as the

Update 2014-12-05 10:22 GMT:

If you have any questions or comments regarding this ascending triangle on GBP/JPY chart, please feel free to submit them via the form below.