
This double bottom pattern is less pronounced than a much similar EUR/USD double top but nevertheless, it terminates as significant correction on the USD/CAD chart and looks valid. Indeed, the formation looks spiky, is rather short, and is quite below the bottom’s resistance line. At the same time, it is symmetrical and demonstrates an important failed lower low.
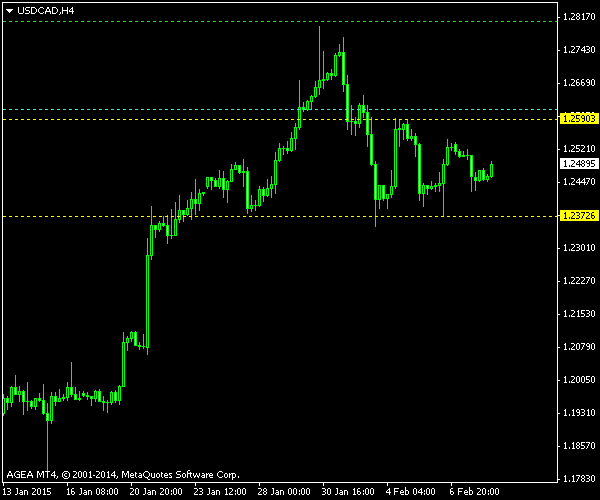
You can see the pattern marked with the yellow lines on the chart screenshot below. The cyan entry line is placed at 10% of pattern’s height above the upper border. The green

The chart was built using the ChannelPattern script. You can download my MetaTrader 4 chart template for this USD/CAD pattern. It can be traded using my free Chart Pattern Helper EA.
Update 2015-02-10: I have decided to cancel this trade as the pattern is no longer valid. It looks like the price has consolidated into a symmetrical triangle, which is very ambiguous in this case:
If you have any questions or comments regarding this double bottom on USD/CAD chart, please feel free to submit them via the form below.