USD/CAD in Descending Channel Since January 2016

A very long descending channel can now be seen on the daily chart of the USD/CAD currency pair. It had started forming right after the multi-year peak registered on January 20. As a continuation pattern, descending channel interrupts an uptrend, which is to be continued following a bullish breakout of the upper border.
The chart screenshot below shows the channel itself outlined with the yellow lines. The cyan line points to an entry level in case of a breakout. It is located at 10% of the channel’s height above the upper border. The green line will serve as my take-profit level and is located at 100% of the same value from the upper border. I will set my stop-loss to the low of the breakout bar or the low of the preceding bar if the breakout one is mostly outside the pattern. You can click on the image to see its full-size version:

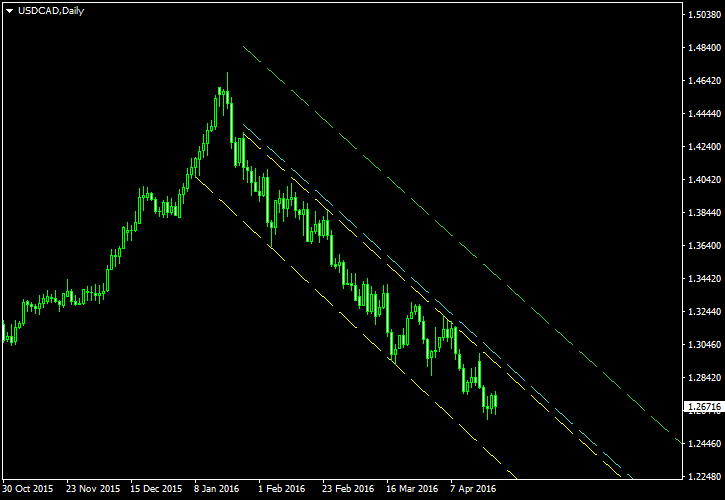
I detected this channel using the Channel Pattern Detector indicator and built this chart using the Channel Pattern Detector indicator. You can download my MetaTrader 4 chart template for this USD/CAD pattern. You can trade it using my free Chart Pattern Helper EA.
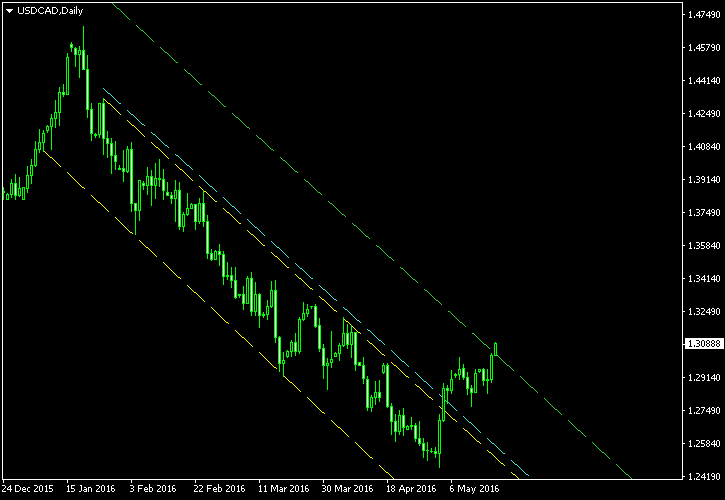
Update 2016-05-05: Breakout trade triggered yesterday at 1.28095 with stop-loss at 1.26963. The current take-profit level is set to 1.32614 but will go down with the declining green line on the chart. The breakout looks quite healthy but today’s candle looks suspiciously weak to me:

Update 2016-05-19: Take-profit level reached today at 00:44 GMT. The actual close price was 1.30400, which is much lower than the original take-profit but was expected considering the slope of the green line:


If you have any questions or comments regarding this descending channel on USD/CAD chart, please feel free to submit them via the form below.

Leave a Reply

Your email address will not be published. Required fields are marked *

− two = six