
A symmetrical triangle has formed on a weekly chart of the EUR/NZD currency pair. It is not a perfect example of such pattern because the upper slope is a bit steeper than the lower one. Nevertheless, it can serve as a good breakout entry setup considering the fact that it acts as a consolidation funnel following a rather strong uptrend wave. It is a
The borders of the triangle are marked with the yellow lines on the chart image below. The cyan line is my breakout entry point located at 10% of the triangle’s base’s height from the upper border. The green line will be my
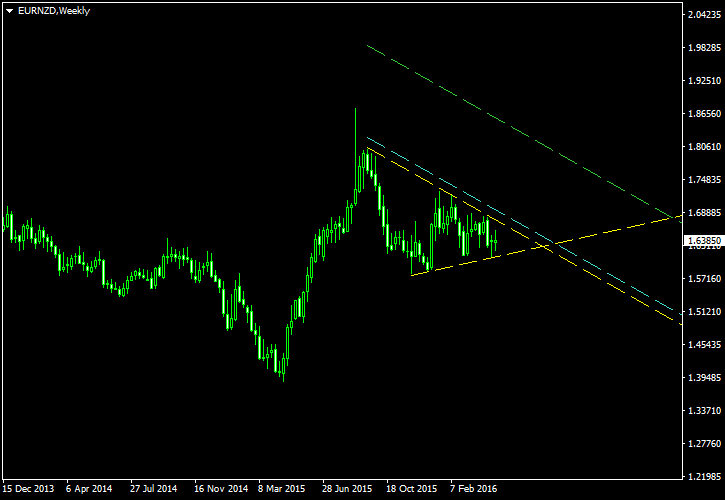
I have built this chart using the ChannelPattern script. You can download my MetaTrader 4 chart template for this EUR/NZD pattern. You can trade it using my free Chart Pattern Helper EA.
Update 2016-05-10: EUR/NZD broke to the upside from this triangle pattern today at 00:08 GMT. Entry triggered at 1.68588 with

Update 2016-06-01: EUR/NZD dropped down to my

If you have any questions or comments regarding this symmetrical triangle on EUR/NZD chart, please feel free to submit them via the form below.