Analyzing EUR/USD on US Presidential Elections Day

EUR/USD daily trading data since January 1971 is readily available from many brokers and demo servers. In theory, this would allow analysis of EUR/USD trading range beginning from the Nixon’s election to his second term on November 7, 1972. In practice, the data we have before 1988 is largely unusable due to poor quality — Open, High, Low, and Close are equal for some days. Also, no data at all is available for election days of 1976 and 1980. Hence, we can only use 7 data points (starting with George H. W. Bush elections) if we want to come to any conclusions regarding EUR/USD traits on this day. Of course, pre-1999 EUR/USD data is synthesized by the brokers based on the 
pre-eurozone basket of currencies.
Below is the table that summarizes EUR/USD trading data for all election days from 1972 to 2012 along with the surrounding Monday and Wednesday sessions.

Date Open High Low Close President Daily
Change Daily
Range 1972-11-06 0.6104 0.6104 0.6104 0.6104   0 0 1972-11-07 No data       Richard Nixon (2nd term) N/A N/A 1972-11-08 0.6097 0.6097 0.6096 0.6096 -1 -1                 1976-11-01 0.8110 0.8113 0.8110 0.8112   2 3 1976-11-02 No data       Jimmy Carter N/A N/A 1976-11-03 0.8127 0.8127 0.8126 0.8126   -1 1                 1980-11-03 1.0226 1.0247 1.0205 1.0225   -1 42 1980-11-04 No data       Ronald Reagan N/A N/A 1980-11-05 1.0075 1.0091 1.0065 1.0075   0 26                 1984-11-05 0.6672 0.6678 0.6657 0.6668   -4 21 1984-11-06 0.6649 0.6649 0.6649 0.6649 Ronal Reagan (2nd term) 0 0 1984-11-07 0.6672 0.6698 0.6656 0.6671   -1 42                 1988-11-07 1.0959 1.0961 1.0943 1.0959   0 18 1988-11-08 1.0958 1.1017 1.0929 1.0958 George H. W. Bush 0 88 1988-11-09 1.1085 1.1107 1.1041 1.1083   -2 66                 1992-11-02 1.2686 1.2698 1.2445 1.2501   -185 253 1992-11-03 1.2499 1.2553 1.2403 1.2475 Bill Clinton -24 150 1992-11-04 1.2467 1.2616 1.2403 1.2467   0 213                 1996-11-04 1.2935 1.2965 1.2889 1.2937   2 76 1996-11-05 1.2937 1.2968 1.2850 1.2868 Bill Clinton (2nd term) -69 118 1996-11-06 1.2870 1.2918 1.2811 1.2896   26 107                 2000-11-06 0.8662 0.8732 0.8557 0.8634   -28 175 2000-11-07 0.8632 0.8666 0.8576 0.8606 George W. Bush -26 90 2000-11-08 0.8607 0.8693 0.8516 0.8549   -58 177                 2004-11-01 1.2818 1.2833 1.2716 1.2753   -65 117 2004-11-02 1.2753 1.2758 1.2663 1.2744 George W. Bush (2nd term) -9 95 2004-11-03 1.2743 1.2832 1.2655 1.2826   83 177                 2008-11-03 1.2766 1.2897 1.2576 1.2584   -182 321 2008-11-04 1.2586 1.3048 1.2526 1.2994 Barack Obama 408 522 2008-11-05 1.2995 1.3114 1.2793 1.2926   -69 321                 2012-11-05 1.2820 1.2842 1.2767 1.2797   -23 75 2012-11-06 1.2797 1.2826 1.2763 1.2809 Barack Obama (2nd term) 12 63 2012-11-07 1.2809 1.2876 1.2736 1.2771   -39 140

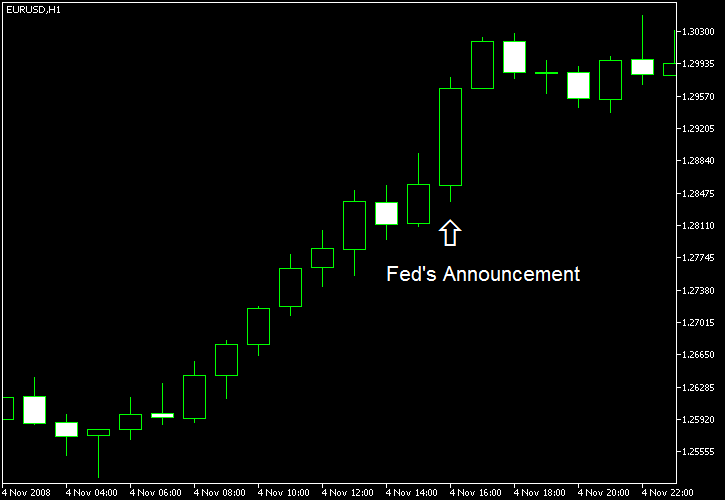
As can be seen on the table above, the election day trading has been calmer compared to the Monday before and Wednesday after. The only exceptions are November 5, 1996, when Bill Clinton has been elected for his second term and November 4, 2008, when Barack Obama has been elected for his first. The latter is patially explained by an overall increased volatility during late 2008 (peak of the financial crisis); on that day, the Fed announced that it lent $138.939 billion through Term Auction Facility on November 3:

Evidently, there is not much effect of the US presidential election day on the Forex market (at least on EUR/USD). Other factors play a much more significant role during the day. Although we lack a sufficiently large sample to consider this as a proof of anything, the data we have just provides another reason to look at the whole picture and not to limit our analysis to some single event.
If you believe that there are some exploitable peculiarities in EUR/USD behavior during the US presidential elections day, please use the commentary form below to share your ideas.

Leave a Reply

Your email address will not be published. Required fields are marked *

thirteen + = 21