
Christmas and New Year holidays should be a quiet time in the Forex market, but these three chart patterns below will help you keep yourself busy during the period and at the start of 2017.
All patterns are drawn using the same principles: the borders are shown with the yellow lines. The cyan lines serve as the entry points (they are detached from the borders using a 10% buffer). The green lines are
The bullish pennant on the daily chart of USD/JPY tells a tale of a
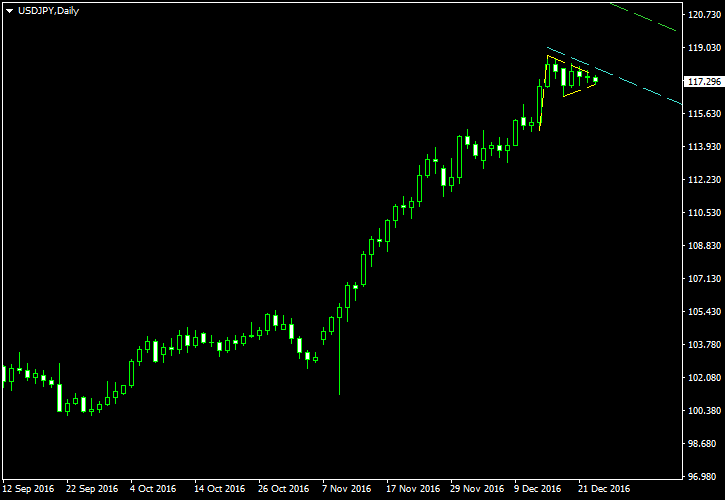
Update 2016-12-28 7:02 GMT: Entry triggered at 117.710 about 5 hours ago.

Update 2016-12-28 20:07 GMT: The trade hit

This

Update 2017-01-12 12:02 GMT: The sell order triggered some 4 hours ago. The open price is 1.30927 with

Update 2017-03-08 20:15 GMT: The trade has hit its

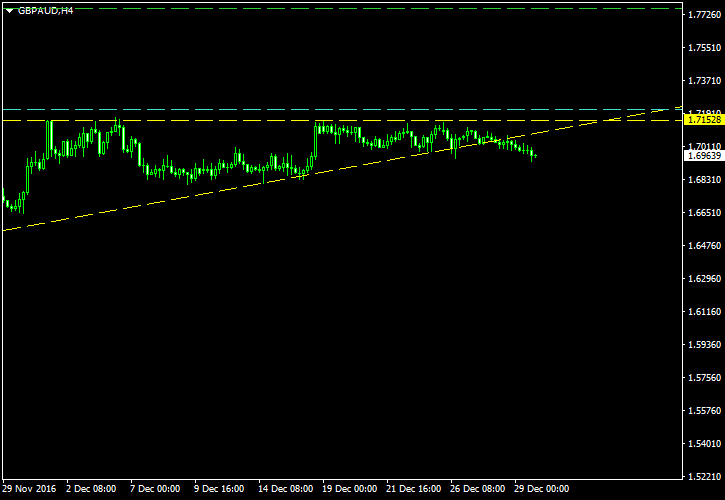
The British pound is consolidating against the Aussie in a sort of an ascending triangle since the end of November. Despite its major fundamental weakness, the pound will demonstrate a notable upswing should the rate breakout through the triangle’s upper border:

Update 2016-12-29: I am cancelling the trade setup as the triangle has been broken at its lower border:
I detected the ascending channel using the Channel Pattern Detector indicator.
I have built all these charts with the help of the ChannelPattern script.
You can download the chart templates for MetaTrader 4 platform: USD/JPY, USD/CAD, GBP/AUD.
You can trade these setups using my free Chart Pattern Helper EA.
If you have any questions or comments regarding the three patterns analyzed in this post, please feel free to reply using the commentary form below.