
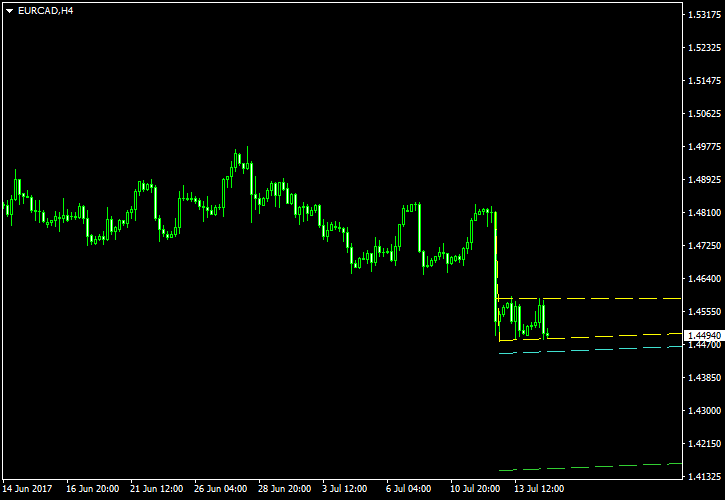
Following the surge of the Canadian dollar on Wednesday, July 12, induced by the central bank’s rate hike, the EUR/CAD currency pair has formed a bearish pennant pattern on its H4 chart. Although it resembles a flag pattern, the converging edges make it technically a pennant.
The chart screenshot below shows the pennant formation marked by the yellow lines. The cyan line marks the entry level positioned at 10% of the pennant’s height below the lower border. The green line represents my
You can download my MetaTrader 4 chart template for this EUR/CAD pattern. It can be traded using my free Chart Pattern Helper EA.
Update 2017-07-19 5:57 GMT: I had to cancel the trading setup as the price had already broken through the upper border, invalidating the bearish pennant pattern:

If you have any questions or comments regarding this bearish pennant on EUR/CAD chart, please feel free to submit them via the form below.