After hitting its multi-year low against the Japanese yen back in November of 2016, the Canadian dollar has done a great deal of recovering even though the first half of 2017 was a pure downtrend for the loonie. The current upward wave is completing the inverse head-and-shoulders pattern on a weekly timeframe.
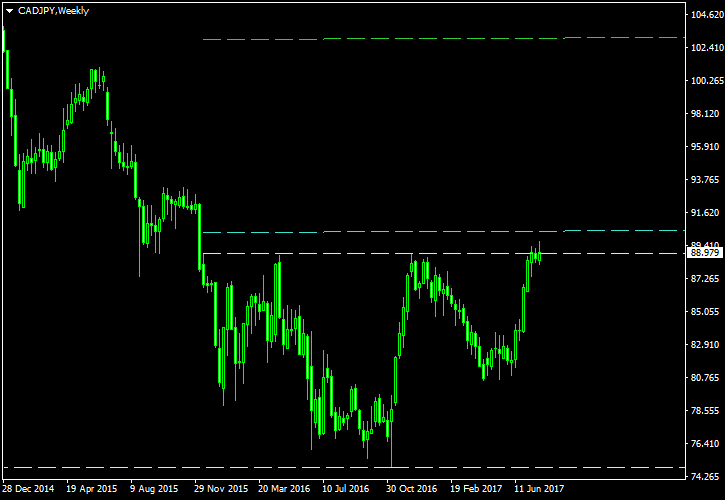
Below, you can see the pattern marked with the yellow lines. Although, the neckline seems to be broken, the currency rate has not yet reached my entry level, which is positioned with a 10% buffer distance. The green line will serve as my take-profit level — I have placed it at 100% of the pattern’s height above the neckline. The low of the breakout candle will serve as my stop-loss. If the breakout candle trades mostly above the neckline, I will use the low of the previous candle (or the first one that qualifies). I will ignore bearish breakouts from this formation as an inverted head-and-shoulder is a reversal pattern, which should trigger an uptrend after a long decline:
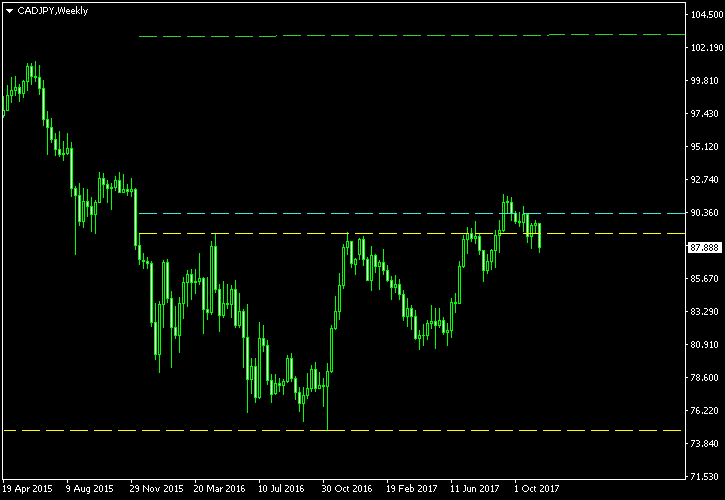
The chart was built using the ChannelPattern script. You can download my MetaTrader 4 chart template for this CAD/JPY pattern. It can be traded using my free Chart Pattern Helper EA. Update 2017-09-12: The entry triggered yesterday at 19:07 GMT with an open price of 90.337, stop-loss at 87.544, and take-profit at 103.028. The breakout looks sufficiently strong. I hope the pair has still enough momentum to continue moving upwards: Update 2017-11-17: The stop-loss of 87.544 has been hit today at 16:04 today:
If you have any questions or comments regarding this inverted head-and-shoulders on CAD/JPY chart, please feel free to submit them via the form below.