A successful currency trader needs a proven trading strategy. Many traders prefer strategies based on trends. Such strategies work best with currency pairs that trend well. Monitoring a predominantly
Contents
- 1 List of currency pairs
- 2 Methodology
-
3 Calculations
- 3.1 Rate change
- 3.2 Volatility
- 3.3 Consecutive closing above/below moving average
- 3.4 Higher High + Higher Low and Lower Low + Lower High
- 4 Conclusions
List of currency pairs
A retail FX trader should always choose an asset that has enough liquidity. It should not be difficult to get in or out of a trade. Furthermore, the Bid/Ask spread should not be wider than 3 pips an hour before or after some critical news event. The chosen currency pair should be volatile enough to provide considerable amount of trading opportunities. Ten currency pairs listed below in alphabetical order satisfy these conditions. According to the latest Triennial Central Bank Survey, they account for more than 50% of the daily trading volume in the foreign exchange market:
Methodology
We begin assessing the trend by subtracting the opening rate from the closing rate for a given time period. Obviously, this is a crude method of analysis. However, it can give us some hints on the pairs that trend often. Further, we also calculate a currency pairâs volatility. That will help traders to compare the trendedness of a currency pair with its susceptibility to unpredictable rate spikes.
The above calculation would be only a starting point. To identify the best of the trending currency pairs, we need to calculate precisely the number of periods a pair had been in a trend during some span of time. We need a dependable indicator to identify trend in at least three different timeframes. We use moving average for that purpose. We calculate the average and median number of consecutive closes above/below the moving average. By ranking the average of the number of closes above/below a moving average, we arrive at the most trending pair in a daily, weekly, and monthly chart.
Beginners are often advised to use an exponential moving average instead of a simple one as the former lags less (i.e. it follows a trend more quickly). We verify that as well by applying the calculations to both simple and exponential 50-period moving average.
Another method we use to assess the trendedness of the currency pairs is the consecutive
To sum up, we shall calculate:
All calculations are repeated on three timeframes: daily, weekly, and monthly. All currency pairs are analyzed using the data of 69 months between 2012-01-01 and 2017-09-30.
Calculations
Rate change
We can calculate the positive or negative net change in the exchange rate of a currency pair in a given day, using the following formula:
![]()
where N is the total number of periods.
We rank the currency pairs using absolute value as the quantum of rate change is studied. Since the exchange rates of currency pairs differ significantly (e.g., >100 for USD/JPY and <1 for EUR/GBP), the average rate change is measured as a percentage.
As mentioned earlier, the above formula is a crude method of analysis. However, it gives us an idea of probable net movement in a currency pair.
The weekly and monthly Open and Close data can be substituted in the above formula to identify the average probable rate change in a given week or month.
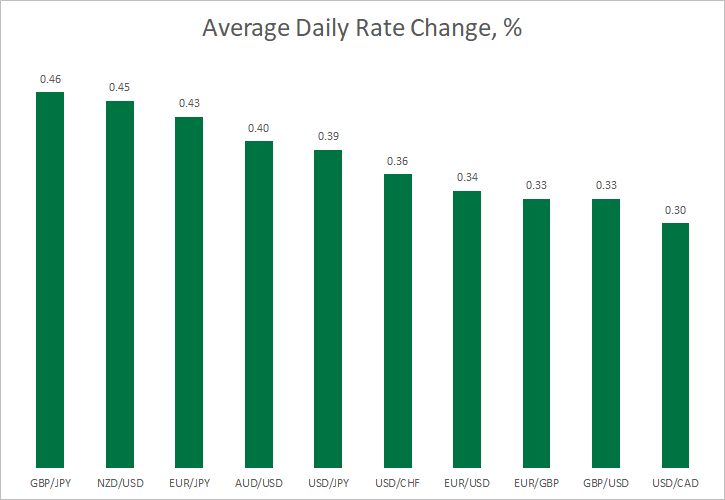
The table provides the 5-year average percentage (%) rate change values of the studied currency pairs for three timeframes.
The table above clearly reveals that the
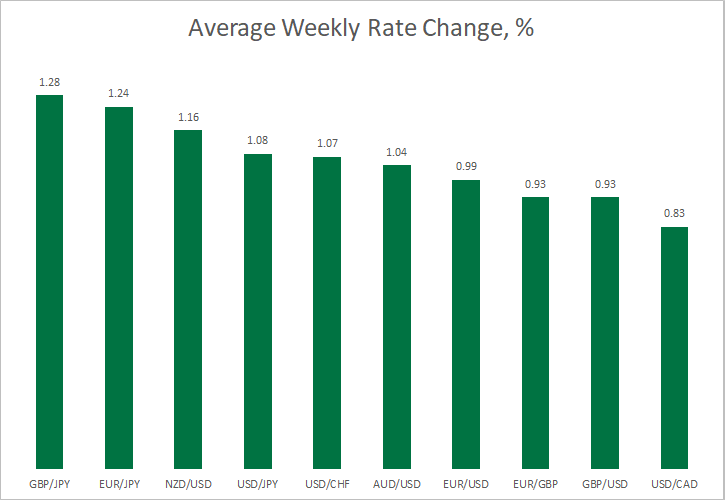
The weekly trend chart reveals a similar situation. Again, the GBP/JPY pair leads its rivals with an average weekly rate change of 1.28%. EUR/JPY and NZD/USD follow with an average weekly rate change of 1.24% and 1.16%, respectively. Likewise, USD/CAD, GBP/USD, and EUR/GBP occupy the last three positions in the weekly ranking list.
The monthly statistics is not very different. While the average monthly rate change of the GBP/JPY currency pair is 2.95%, the average rate change of NZD/USD is 2.71%. The EUR/JPY pair takes the third position with an average rate change of 2.61% per month over the past five years.
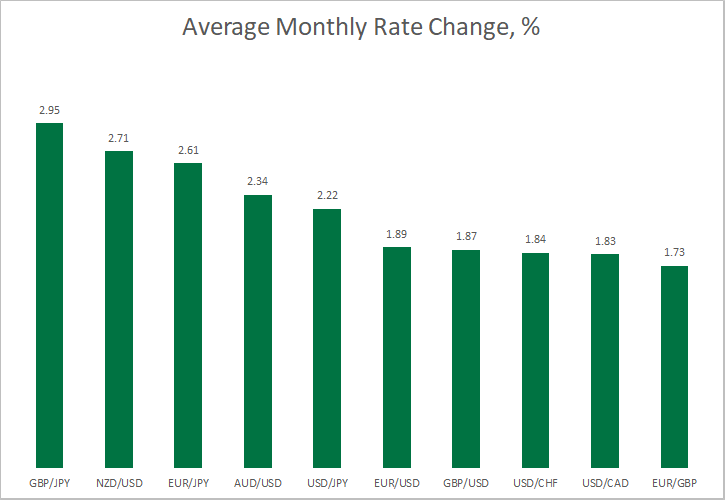
Notably, the top three places are occupied by the same currency pairs on the daily, weekly, and monthly charts. Likewise, the USD/CAD and EUR/GBP pairs have exhibited the least trade change on all three scales.
Volatility
The volatility of a currency pair can be calculated using the formula:
![]()
where N is the total number of periods.
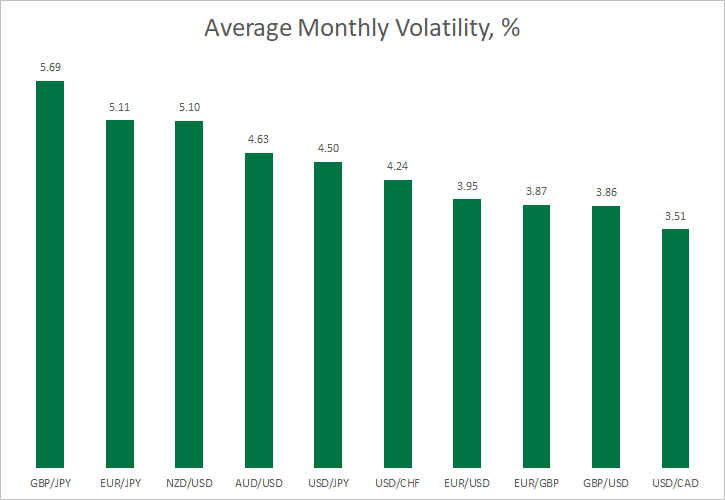
The table summarizes the 5-year average percentage (%) volatility values of the studied currency pairs for three timeframes.
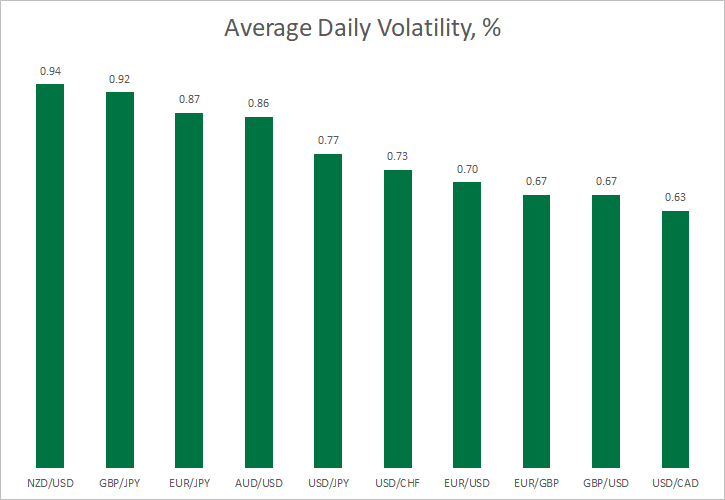
The NZD/USD currency pair leads the show with an average daily volatility of 0.94% over the past five years. The GBP/JPY pair follows the suit with an average of 0.92%. EUR/JPY takes the third position with an average of 0.87%. The fourth to tenth ranks reflect the order in the average daily rate change ranking list.
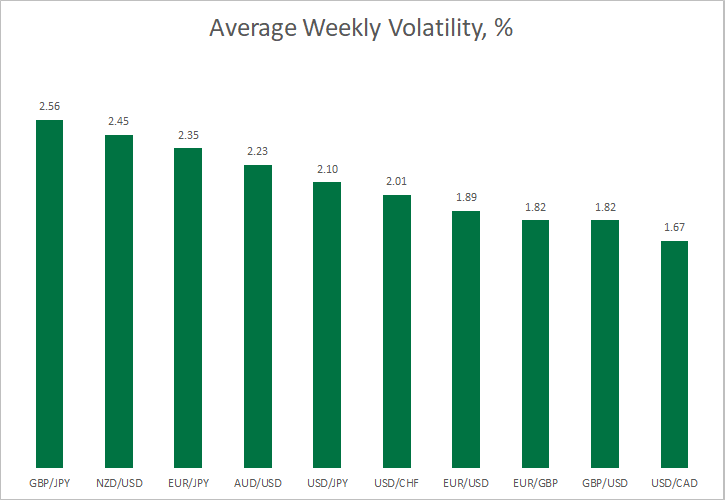
The weekly volatility graph paints a similar picture. The GBP/JPY and NZD/USD pairs take the first two ranks, with the average values of 2.56% and 2.45%. The EUR/JPY pair takes the third rank with a weekly average of 2.35%. From the rest of the pairs, the daily and weekly average volatility rankings are alike.
The monthly average volatility data does not provide any surprises. The GBP/JPY and EUR/JPY currency pairs take the top two ranks with the average monthly volatility values of 5.69% and 5.11%, respectively. NZD/USD takes the third place with an average monthly volatility of 5.10% over the analyzed period. The daily, weekly, and monthly volatility data indicate that the same currency pairs occupy the top three places. Similarly, the same currency pairs occupy the fourth to seventh positions in the daily, weekly, and monthly volatility ranking list.
From the above rate change and volatility data, we can infer that GBP/JPY, NZD/USD, and EUR/JPY are the three most trending and volatile pairs. We can now validate the results by calculating the Forex pairs’ consecutive closes above and below an SMA and EMA during the past five years.
Consecutive closing above/below moving average
One of the most elementary methods to detect Forex trends is to use a moving average. We calculate the average and median number of consecutive closes above and below a 50-period (daily, weekly, and monthly) moving average (SMA and EMA).
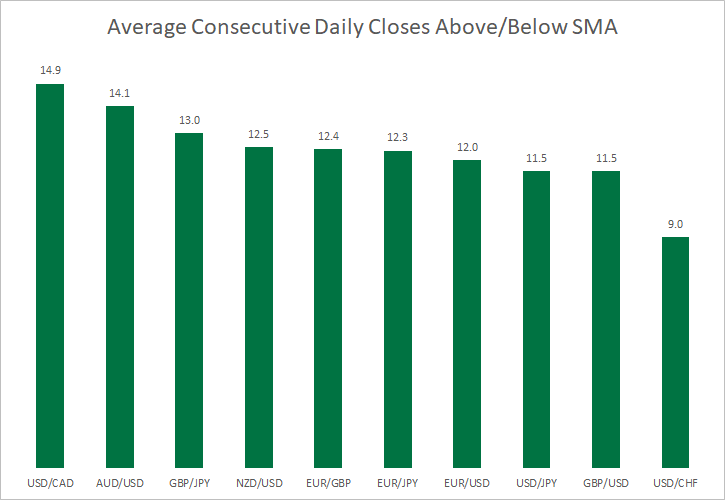
We can infer that USD/CAD is the best trending pair on a daily chart, when a 50-period SMA is used to identify trends. The AUD/USD and GBP/JPY pairs take up the next two ranks with an average of 14.1 and 13.0 closes above/below the SMA. The USD/CHF is the least trending pair with an average of only 9.0 closes above or below the SMA.
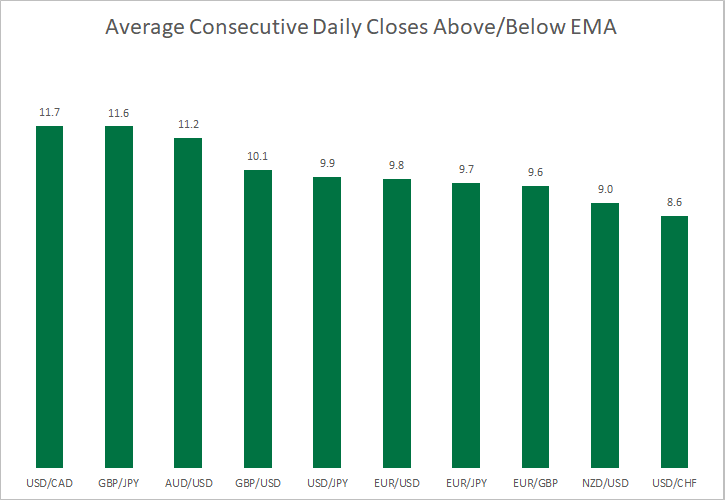
When an EMA is used to identify the trend on daily timeframe, USD/CAD again takes the top position. The GBP/JPY and AUD/USD pairs, with an average number of closes at 11.6 and 11.2, respectively, take the second and third position. The USD/CHF currency pair is the last one when measured by both EMA and SMA. Notably, GBP/JPY has got one of the top three ranks in the average daily rate change and volatility list.
Median values correlate heavily with the average values in this table with a notable exception of NZD/USD, which can be expected to trend the most after crossing its 50-day simple moving average.
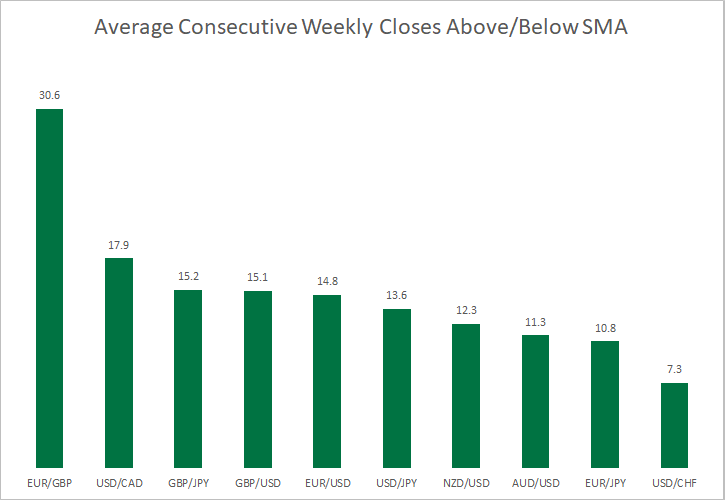
When we calculated the average number of closes above/below the 50-week SMA, we found the EUR/GBP pair as the best trending pair with an average of 30.6 closes. The USD/CAD and GBP/JPY pair are placed at the second and third place in the ranking list. However, their averages are only 17.9 and 15.2. USD/CHF takes up the last spot with an average number of 7.3.
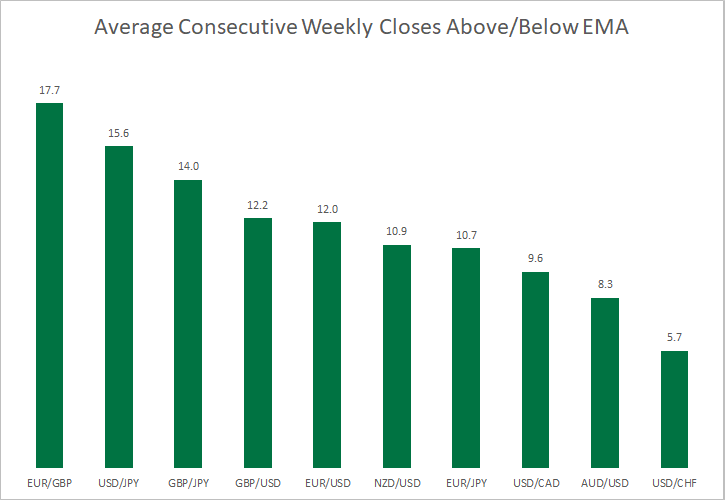
If we look at the same metrics using the 50-week EMA, the EUR/GBP currency pair is a clear leader with the average number of closes at 17.7. USD/JPY and GBP/JPY are the second and third best trending pair with an average of 15.6 and 14.0 closes above/below the 50-week EMA. Notably, the USD/CAD pair does not fare well when the trend is identified with an exponential moving average. Still, it is USD/CHF, which occupies the last place with both types of moving average.
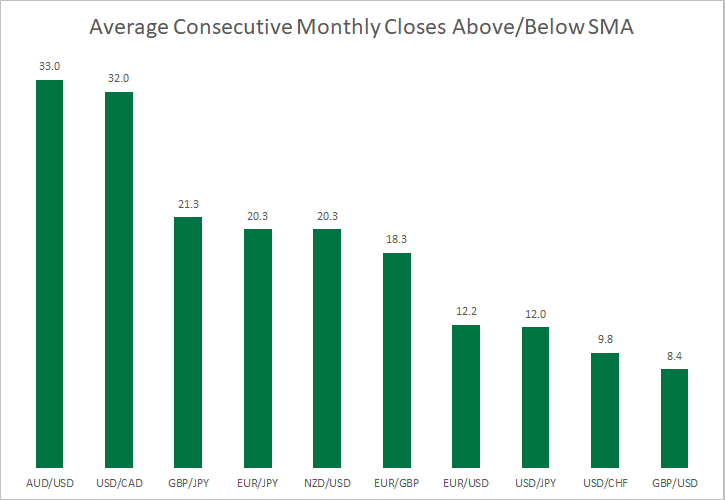
On a monthly timeframe, the AUD/USD currency pair is the best trending pair, with an average of 33 months above or below its SMA 50. USD/CAD is placed next in the rank list with an average of 32. GBP/JPY pair occupies a distant third place with an average of 21.3. USD/CHF, which took the last place in the ranking list based on daily and weekly timeframes, has improved by one position to occupy the ninth place here. The GBP/USD pair is the worst trending pair on a monthly chart, when the assessment is made with a simple moving average.
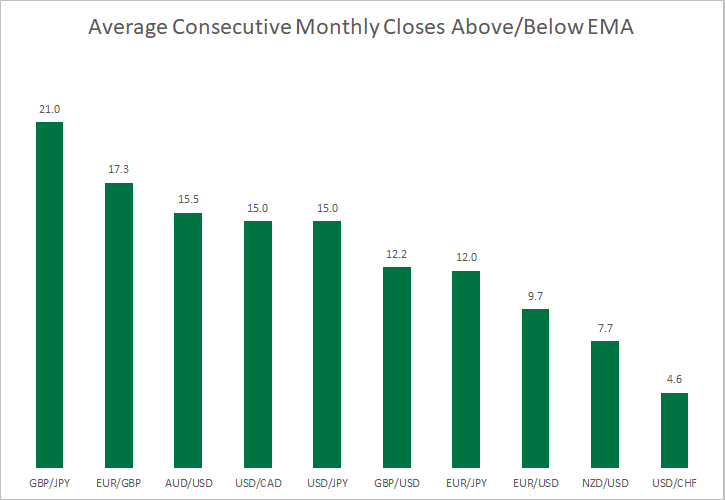
GBP/JPY is the best trending pair on a monthly chart when measured with an EMA. EUR/GBP has taken the second place. The AUD/USD pair has occupied the third position with an average of 15.5 consecutive closes above/below its EMA. Interestingly, the USD/CAD pair moved down from the second to fourth rank compared to SMA method. So, we can infer that the monthly chart trends in USD/CAD are much better measured using a simple moving average.
Notably, so far in all the tables provided above, the GBP/JPY currency pair occupies one of the top three ranks.
Higher High + Higher Low and Lower Low + Lower High
A currency pair is generally believed to be trending if it forms consecutive Higher Highs with Higher Lows (HHHL) in an uptrend or Lower Low with Lower Highs (LLLH) in a downtrend. Additionally, a pair has to close above its open level for a rising trend and below its open for the falling trend. We calculate the average number of HHHL and LLLH patterns for each currency pair on the daily, weekly, and monthly timeframes.
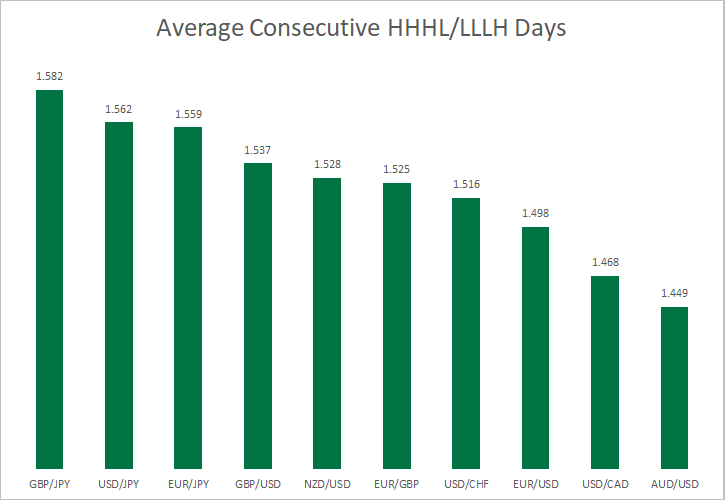
The GBP/JPY currency pair, once again, outclasses every other currency pair taken for study and remains the best trending pair on a daily chart when we assess it with consecutive HHHL and LLLH method. While the average length of HHHL/LLLH streaks is 1.582 for GBP/JPY on a daily timeframe, USD/JPY gets close with an average of 1.562. EUR/JPY takes the third place with an average of 1.559 days. Notably, all three best pairs here are quoted in the Japanese yen. The AUD/USD pair gets the last rank with an average of 1.449 HHHL/LLLH formations.
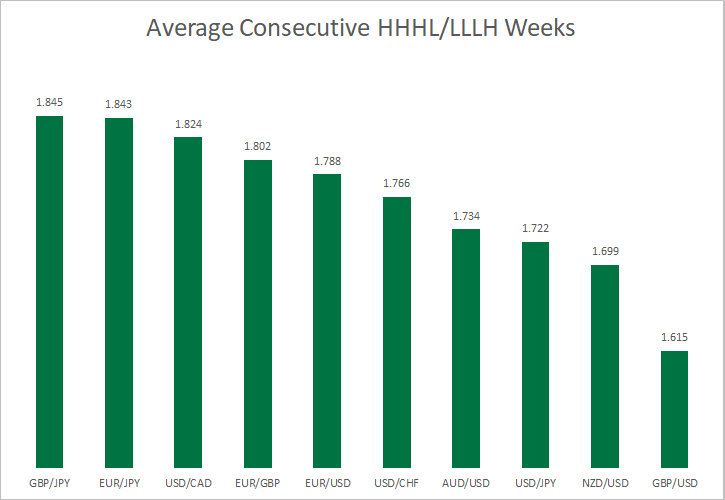
The yen continues its domination in the list of best trending currency pairs on the weekly chart as well. While GBP/JPY takes the top spot with an average trend length of 1.845 weeks, EUR/JPY follows closely with an average of 1.843. The USD/CAD currency pair, which is not a very trending pair on the daily timeframe, has now taken the third place with an average of 1.824 weeks. The GBP/USD pair takes the last place with an average of 1.615 consecutive HHHL/LLLH formations.
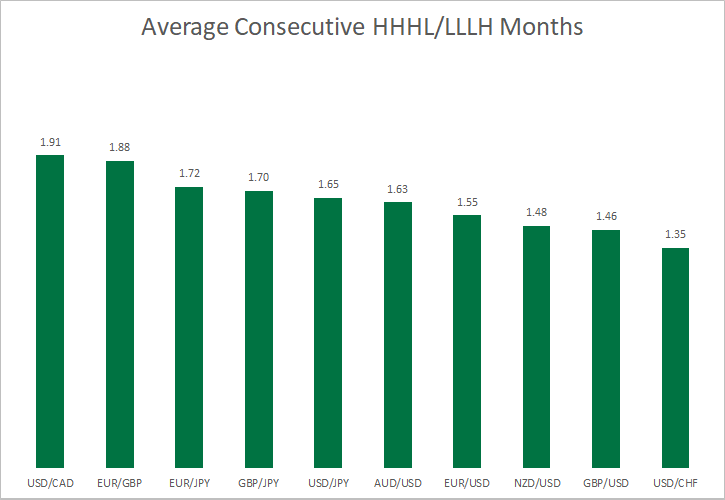
Surprisingly, on a monthly chart, USD/CAD outshines all other currency pairs in trendedness, with an average of 1.91 consecutive HHHL/LLLH candles. The EUR/GBP and EUR/JPY currency pairs, with the averages of 1.88 and 1.72, take up the second and the third rank. Similarly to the weekly charts, GBP/USD performed worse than nearly every pair, except for USD/CHF, which stands last with an average number of mere 1.35. GBP/JPY, which topped the daily and weekly charts in trendedness, takes only the fourth position on a monthly timeframe, with an average of 1.70.
Conclusions
Our research has revealed the following facts based on the studied period of 69 months:
Additionally:
The behavior of a currency pair as identified in the study may or may not hold good because the past performance is not an indication of the future performance. However, our humble research can certainly serve as a starting point for traders looking for a suitable currency pair to trade on daily, weekly or monthly charts.
If you have some questions or suggestions regarding this study of the major currency pairs’ trendedness, please use the commentary form below to submit them.