GBP/USD in Month-Long Symmetrical Triangle on H4

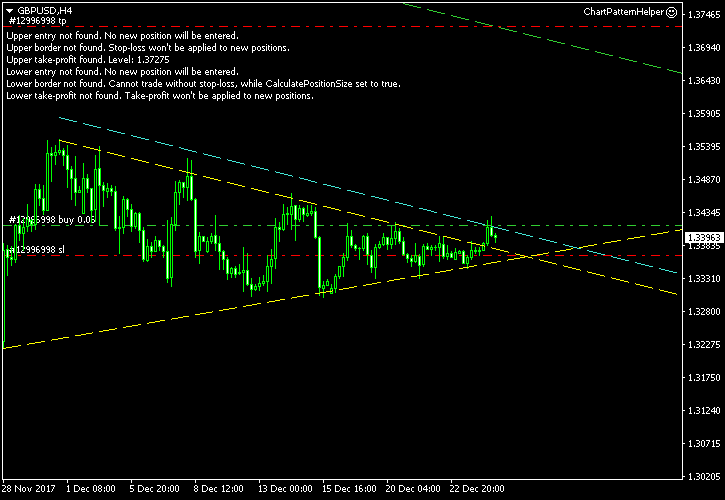
The 4-hour timeframe chart of the GBP/USD currency pair is currently showing a long-term consolidation that took a form of a symmetrical triangle pattern. As the formation follows the ascending trend, an upside breakout from the triangle will offer a valid buy trading signal for the pound.
If you look at the chart below, the yellow lines mark the triangle itself. The cyan line is where my own entry point will be in case of a breakout. The line is positioned with a buffer distance, which is equal to 10% of the triangle’s height at base. 100% of the height is used to set my take-profit level, which is marked with a green line on the chart. As for the stop-loss, I will set mine to the low of the breakout candle unless its bigger part is located outside the triangle. In that case, I will use the low of the previous candle. I will ignore bearish breakouts from this trend continuation pattern. You can click on the image to see a full-size screenshot:

I have built this chart using the ChannelPattern script. You can download my MetaTrader 4 chart template for this GBP/USD pattern. You can trade it using my free Chart Pattern Helper EA.
Update 2017-12-27: The breakout occurred today at 9:47 GMT with the entry rate of 1.34147, stop-loss at 1.33671, and take-profit at 1.37259. The breakout does not look particularly strong.

Update 2018-01-12 11:40 GMT: My first closed trade this year turns out to be quite lucky. GBP/USD has hit my take-profit of 1.36262 just some half an hour ago, giving me a 4.8 risk-to-reward gain.

If you have any questions or comments regarding this symmetrical triangle on the GBP/USD chart, please feel free to submit them via the form below.

Leave a Reply

Your email address will not be published. Required fields are marked *

+ seventy three = 83