
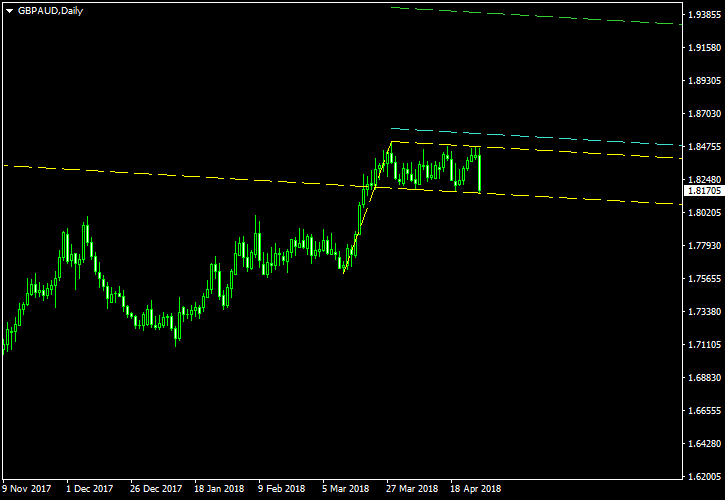
Following a failed symmetrical triangle formation in early March, the British pound has formed a bullish flag pattern versus its Aussie counterpart. The flag part is now about one month long and follows a pronounced upswing in the currency pair.
The chart screenshot below shows the flag’s borders and the pole marked with the yellow lines. My potential entry level is marked with the cyan line and is located at 10% of the pole’s length above the upper border. The take-profit level is marked with the green line and is located at 100% of the same distance. I will set my stop-loss to the low of the breakout candle unless it is trading mostly above the upper border. In that case, I will use the low of the preceding candle. This pattern is good only for bullish breakout trading. I will cancel the setup in case of a bearish breakout. You can click on the chart to see its full-size version:
I have built this chart using the ChannelPattern script. You can download my MetaTrader 4 chart template for this GBP/AUD pattern. You can trade it using my free Chart Pattern Helper EA.
If you have any questions or comments regarding this bullish flag on the GBP/AUD chart, please feel free to submit them via the form below.