CAD/JPY was trading in a strong downtrend since the beginning on the year, but that decline turned to a minor rally in mid-March. It entered a consolidation phase just less than a month later. The currently visible double top can serve as a reversal pattern to let the currency pair return to its long-term downtrend.
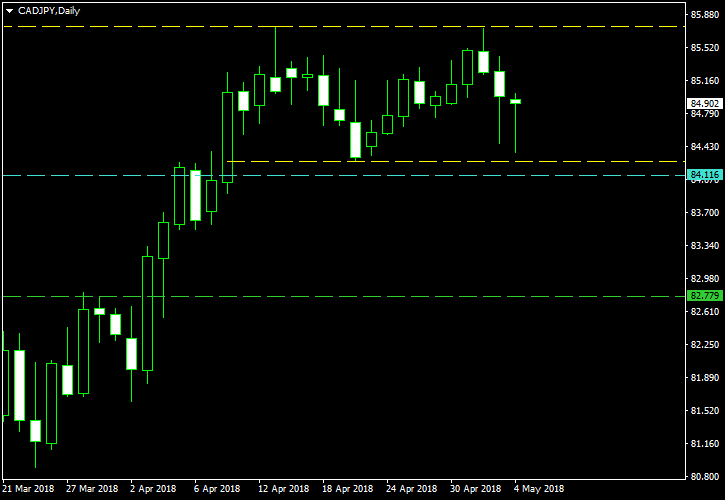
On the chart below, you can see the yellow lines marking the tops and the “neckline” of the double top formation. The cyan line will be my breakout entry level. It is placed at 10% of the pattern’s height below the “neckline.” My take-profit level is marked with the green line, which is positioned at 100% of the height below the “neckline”. I will set my stop-loss to the high of the breakout candle or to the high of the preceding one if the breakout candle appears to be mostly outside the formation. I will ignore upward breakouts from this double top pattern. You can click on the image below to see a full-size screenshot:

I have built this chart using the ChannelPattern script. You can download my MetaTrader 4 chart template for this CAD/JPY pattern. You can trade it using my free Chart Pattern Helper EA.
If you have any questions or comments regarding this double top on the CAD/JPY chart, please feel free to submit them via the form below.