
News and Talking Points – Bitcoin, Ripple, Ether, Litecoin
– Prices ending the week higher in low turnover.
– If chart support levels hold, further gains may be on the cards.
To see how retail traders are currently positioned in cryptocurrencies and what it means for the market looking forward, download the IG Client Sentimentpage.
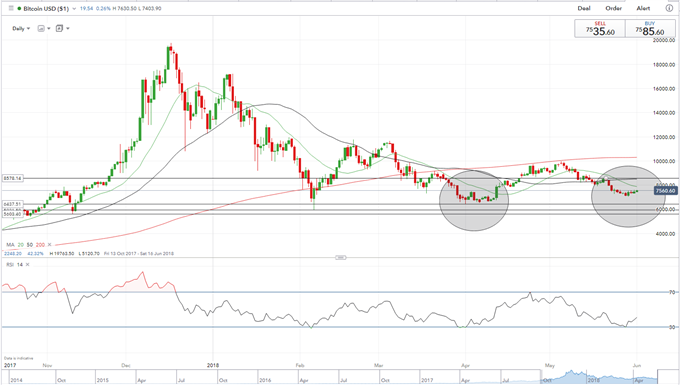
Bitcoin Building a Base for Another Move Higher?
The largest cryptocurrency ends the week marginally higher and is currently building a base for a potential move higher, while the RSI indicator sees BTC bouncing back from oversold territory. BTC has good support between $5603 and $6438 and is unlikely to threaten support in the short-term – all things being equal. On the upside $8578 looks a likely first target before the coin re-tests the recent the recent high just above $10,000.
Bitcoin (BTC) Daily Price Chart in US Dollars (October 2017 – June 1, 2018)
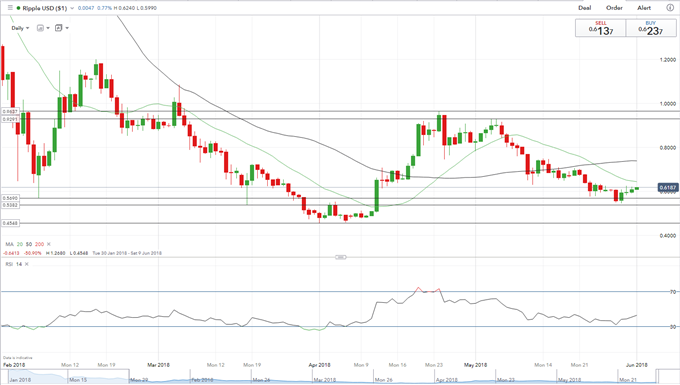
Ripple Remains Rangebound
Ripple continues to trade either side of $0.60 and likely needs a fresh fundamental push to break this level. IG Client Sentiment continues to show that retail is heavily net-long the token – currently around 96% – which does leave a possible sharp move to the downside a possibility. Support between $0.54 and $0.58 should hold in the short-term although a sell-off back to $0.46 cannot be discounted. A break and close above $0.96 would put bulls back in control of short-term price action.
Ripple (XRP) Daily Price Chart in US Dollars (February – June 1, 2018)
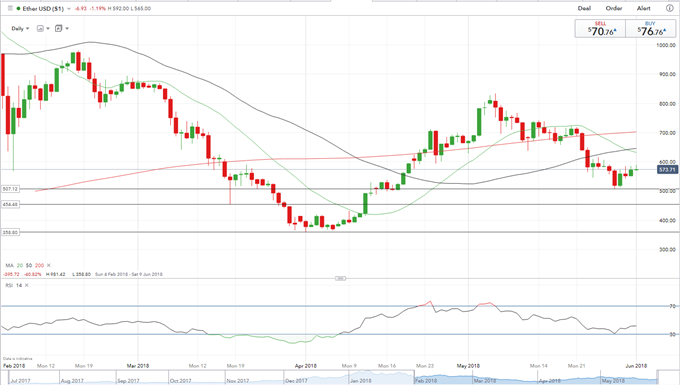
Ether’s Higher Lows Point to Further Gains
A series of five higher lows this week helped Ether rebound strongly from the $500 area and leaves the token eyeing $600 or potentially higher. Upside targets include the 20- and 50-day moving averages, at $633 and $644 respectively before the 200-day ma comes into play just above $700. On the downside $500 should provide solid support with $454 below.
Ether (ETH)Daily Price Chart in US Dollars (February – June 1, 2018)
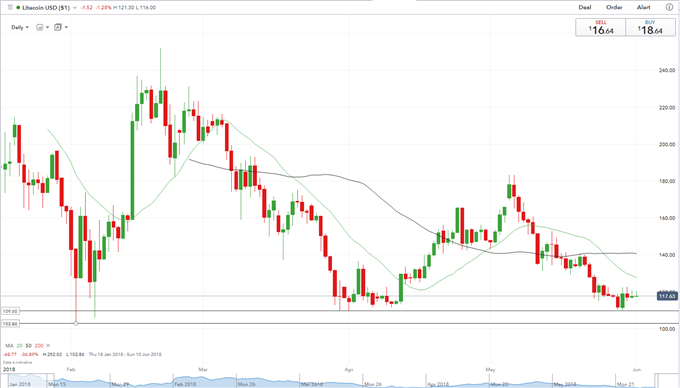
Litecoin Needs Further Consolidation
Litecoin bounced off the double low around $109 made in late-March/early-April early in the week and has been creeping higher ever since. LTC needs to consolidate above the $124 – $129 level – the gap formed on the May 22/May 23 candles – before it can be seen in a positive light. Above this level $140 is the next resistance level. On the downside $109 should provide a reasonable level of support ahead of $103.
Litecoin (LTC) Four Hour Price Chart in US Dollars (January – June 1, 2018)
Essential Cryptocurrency Trader Resources
If you are interested in trading Bitcoin, Ripple, Ether or Litecoin we can offer you a wide range of free resources to help you. We have an Introduction to Bitcoin Trading Guide along with a Free Practice Account. In addition we run a Weekly Bitcoin Webinar and have an IG Bitcoin Sentiment Indicator to help you gauge the market and make more informed trading decisions.
What’s your view of the cryptocurrency market – oversold or overbought? You can leave your comments in the section below or you can contact the author by email at nicholas.cawley@ig.com or via Twitter @nickcawley1.
— Written by Nick Cawley, Analyst.