
FTSE 100 and GBP News and Talking Points
– A new FTSE 100 high may prove difficult in the near-term.
– Sterling continues to build a base, aided by better-than-expected data prints.
The IG Client Sentiment Report shows that traders are just 35% long of the FTSE 100. We typically take a contrarian view to crowd sentiment, and the fact traders are net-short suggests FTSE 100 prices may continue to rise. Yet traders are less net-short than yesterday and compared with last week. Recent changes in sentiment warn that the current FTSE 100 price trend may soon reverse lower despite the fact traders remain net-short.
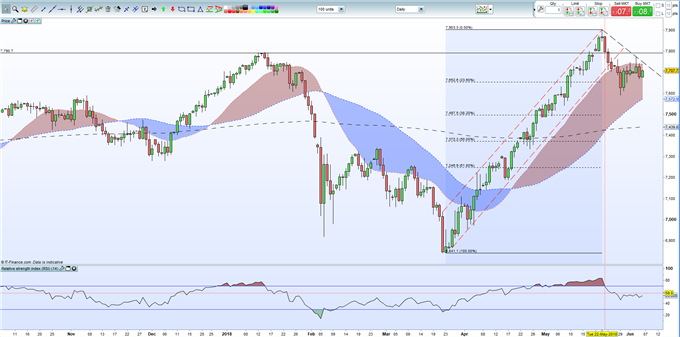
FTSE 100 Chart Shows a Potential Downtrend Forming
The FTSE 100 is likely to leak lower in the near-term after having rallied over 16% in the past two months with the index under pressure from a positive tone in the British Pound. The latest daily FTSE chart shows the early stage of a downtrend forming although further negative price action is required before the trend is confirmed. The chart does highlight that the recent strong uptrend is broken and that a pull-back to Fibonacci retracement levels at 7,562 and 7,372 is possible in the short-term.
The latest decline coincides with a stronger GBP-complex with the currency boosted by better-than-expected PMIs and growing expectations that the tepid UK Q1 growth rate of 0.1% will be boosted to 0.3% or 0.4% in the upcoming Q2 figures.
Risks to the downside scenario include this weekend’s G7 meeting and next week’s Fed and ECB monetary policy meetings. The Federal Reserve is expected to raise interest rates by 0.25%, with further one or two rate hikes expected later this year, while the ECB may well announce a timetable for ending their quantitative easing program, beginning the process of monetary tightening. Both would weaken GBP and in turn give the FTSE 100 a boost via increased company export revenues.
FTSE 100 Daily Price Chart (October 2017 – June 6, 2018)
For a look at next week’s busy data and events schedule the DailyFX Economic Calendar provides a comprehensive and updated guide to all potential market moving events.
Traders may also be interested in two of our most popular trading guides – Traits of Successful Traders and Top Trading Lessons – while technical analysts may be interested in our latest Elliott Wave Guide.
— Written by Nick Cawley, Analyst
To contact Nick, email him at nicholas.cawley@ig.com
Follow Nick on Twitter @nickcawley1