
Bitcoin, Ripple, Ether, Litecoin – Charts, Prices and News
– US Justice Department continues to investigate illegal practices in the cryptocurrency market.
– Bitcoin and Ether are not securities says the SEC.
Cryptocurrency Market Continues to Sag Despite SEC Announcement
After a negative week, the crypto-market got a short-term reprieve after the SEC decided that Bitcoin (BTC) and Ether (ETH) should not be classified as securities, although many ICOs will be. The removal of the ‘securities’ distinction helped BTC and ETH bounce back from double-digit losses made during the week. The rally however proved short-lived leaving most tokens/coins in negative territory for the week and battling strong resistance levels. While the SEC announcement aided the market, the US Justice Department investigation into illegal market practices in the crypto-space – including spoofing and wash trades – continues and the result, either way, may spark a much stronger reaction.
To see how retail traders are currently positioned in cryptocurrencies and what it means for the market looking forward, see the IG Client Sentimentpage.
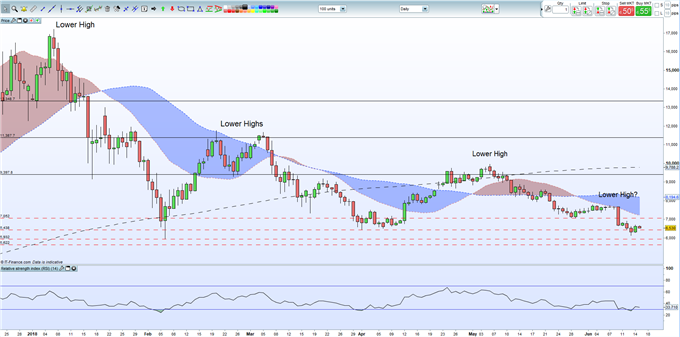
Bitcoin’s Lower Highs Continue to Dominate
Bitcoin’s fall from its all-time high can be seen by the ‘lower highs’ made over the course of 2018 with BTC continuing to struggle with notable resistance levels. On the downside the February 6 low at $5,932 has held so far and protects the November 12 swing low at $5,622. On the upside BTC needs to break decisively through the $7,052 – $7,250 (20-day ma) zone to make further upside progress.
Bitcoin (BTC) Daily Price Chart in US Dollars (August 4, 2017 – May 25, 2018)
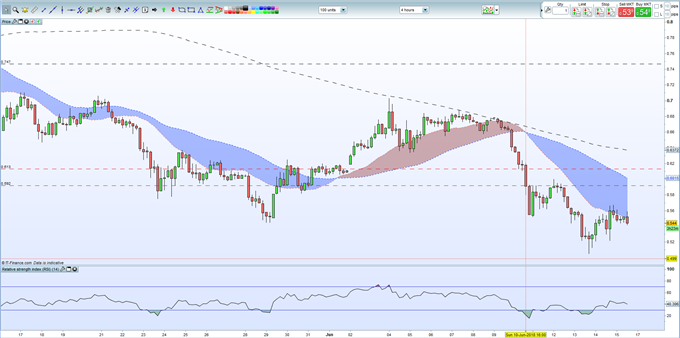
Ripple Remains Weak Below $0.60
Ripple continues to move lower with recent mini-rebounds opening up selling opportunities. Support starts at $0.505 – Wednesday’s low before the April 1 low around $0.45 becomes relevant. A break and close below there opens the way to the $0.22 area, the start of the sharp rally seen at the end of last year. Bulls will be looking at the gap on the June 10 candle around $0.61, then the 200-day moving average at $0.64 and the June 4 recent high at $0.715.
Ripple (XRP) Four Hour Price Chart in US Dollars (May 15 – June 15, 2018)
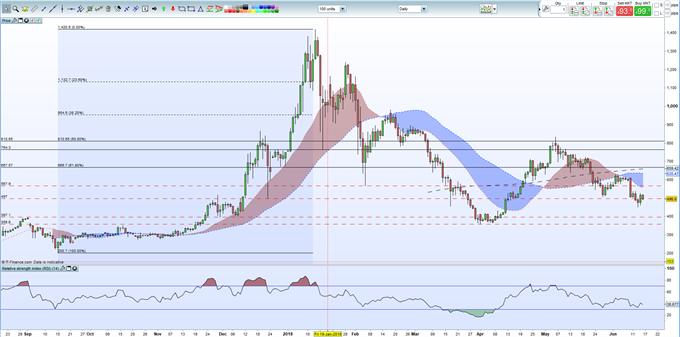
Ether’s Battle with $500 will Dictate Short-Term Direction
Ether continues to trade either side of $500 and the next decisive move should indicate short-term direction for the token. The $497 double-low made on December 12 and 22 remains important and was also the springboard for the last rally starting on April 18. Above here we look at the February 6 low at $567 before a move back to the 61.8% Fibonacci retracement at $668. On the downside, the June 13 low at $450 may prove reasonable support ahead of the late March – early April cluster between $359 and $397.
Ethereum (ETH)Daily Price Chart in US Dollars (September 2017 – June 15, 2018)
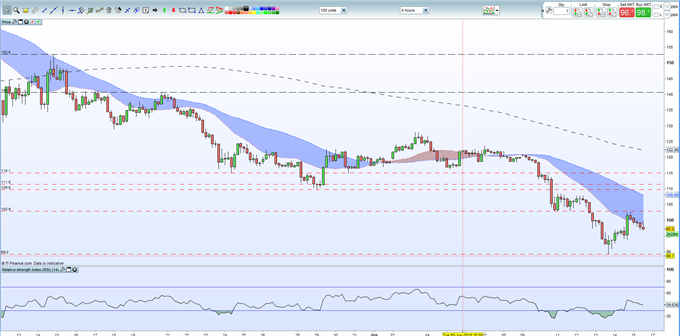
Litecoin Short-Term Trend Points Lower
After a reasonable bounce of the mid-week at $89, LTC has struggled and the short-term trend suggests lower prices. A break back below $89 would leave Litecoin eyeing the $60 area traded back in November 2017. A bullish break above $103 would bring $110-$112 and $115 back into play.
Litecoin (LTC) Four Hour Price Chart in US Dollars (May 12 – June 15, 2018)
Essential Cryptocurrency Trader Resources
If you are interested in trading Bitcoin, Ripple, Ether or Litecoin we can offer you a wide range of free resources to help you. We have an Introduction to Bitcoin Trading Guide along with a Free Practice Account. In addition we run a Weekly Bitcoin Webinar and have an IG Bitcoin Sentiment Indicator to help you gauge the market and make more informed trading decisions.
What’s your view of the cryptocurrency market – oversold or overbought? You can leave your comments in the section below or you can contact the author by email at nicholas.cawley@ig.com or via Twitter @nickcawley1.
— Written by Nick Cawley, Analyst.