
Australian Dollar Analysis and News
- US-China Trade War Sees AUD Under Pressure
- RBA Omits Guidance on Interest Rate Rise
For a more in-depth analysis on AUD, check out our Q2 Forecast
See how retail traders are positioning in AUD as well as other major FX pairs on an intraday basis using the DailyFX speculative positioning data on the sentiment page.
China says US Initiates Trade War
Market sentiment has soured considerably amid the latest escalation in the trade war between the US and China, which followed reports that the US are targeting fresh tariffs on Chinese exports valued at $200bln, while President Trump that 10% tariffs would come into effect if China does not change practices. In the wake of the reports from the US, high beta currencies, most notably the Australian Dollar plummeted to its lowest level since May 2017 given its large exposure to China. Additionally, the decline in industrial metals with iron ore and copper prices falling some 1.5% saw losses in AUD exacerbate (Australia largest exporter of iron ore).
China’s Retaliation to Keep AUD Pressured
China stated that the US have initiated a “trade war” and are not afraid to fight back. As such, China is preparing retaliatory tariffs against the US which will hit one of its most successful export sectors. US sale of oil, gas and coal to China have risen considerably and runs a trade surplus against China, however they now face a possible 25% levy. Headline risk continues to remain high with focus on whether or by how much China will retaliate to $200bln worth of tariffs from the US. Further escalation will likely continue to keep the Australian Dollar pressured.
US China Trade War & a Brief History of Trade Wars – 1900 until Present
The Impact of Tariffs and Trade Wars on the US Economy and the Dollar
RBA Omits Guidance on Rates
Overnight saw the release of the latest RBA minutes, largely the same from previous minutes. However, a notable development was that the RBA omitted the phrase that the “next move in the cash rate would be up rather than down”. This suggests that heightened uncertainty over trade wars is beginning to have an impact on the RBA’s outlook. Given that the Fed recently upped its rate hike trajectory in the short term (4 vs. Prev. 3 2018 rate hikes), this could see a further widening of the US-Australian bond spread moving in favour of AUD selling, US-AU 10yr bond spread wider by 25bps.
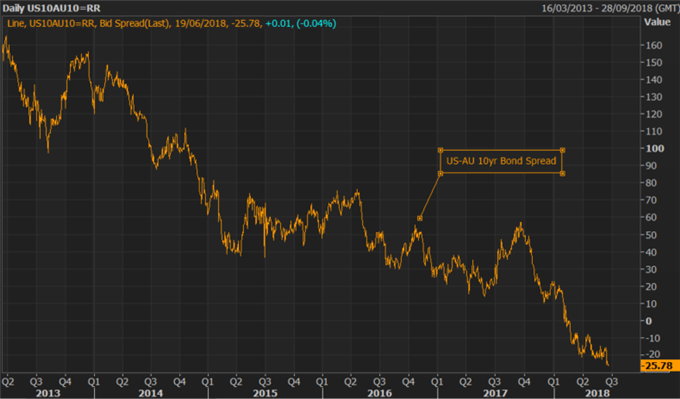
Source: Thomson Reuters
AUDUSD PRICE CHART: DAILY TIME FRAME (October 2016– June 2018)
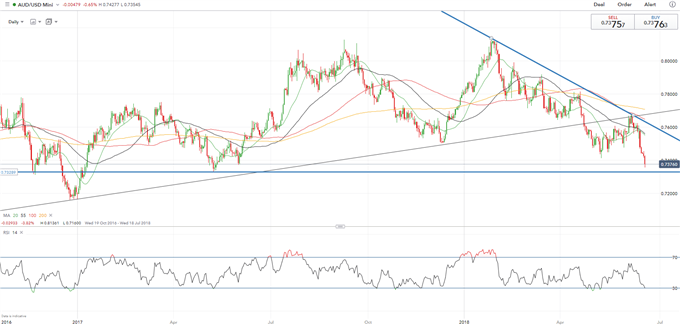
Near term support on the downside situated at 0.7328, which marks the May 2017 low, while a firm break through could push AUDUSD towards the 0.72 handle. Elsewhere, AUDJPY continues to remain very weak and looks at risk of breaking support at the 2018 low situated 80.50.
— Written by Justin McQueen, Market Analyst
To contact Justin, email him at Justin.mcqueen@ig.com
Follow Justin on Twitter @JMcQueenFX