
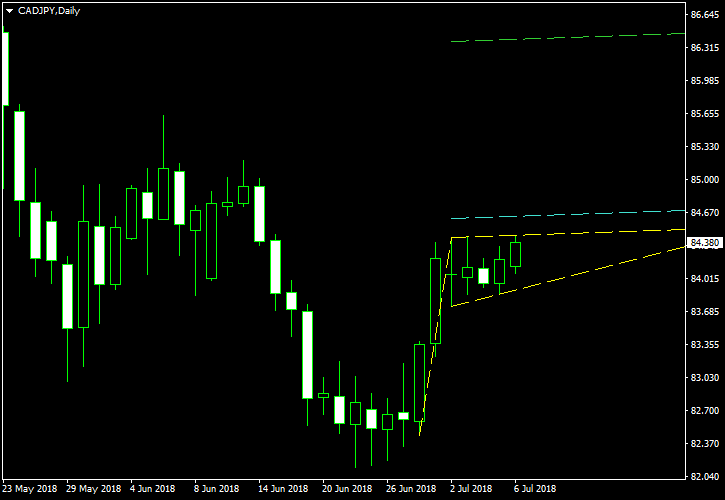
After a strong rally during June 28–29 trading session, CAD/JPY entered a minor consolidation. The formed pattern looks like a bullish pennant albeint an imperfect one (there is a slight upward slope). A bullish breakout would mean a continuation of the previous rally.
The yellow lines mark the pole and the borders of the pennant. The cyan line will serve as my entry level. It is placed at 10% of the pole’s length above the upper border. I will set my take-profit level to the green line, which is located at 100% of the pole’s length above the pennant. I will set my stop-loss to the low of the breakout candle or to the low of the previous candle if the breakout one trades above the border. I do not recommend trading downside breakouts from bullish pennants. You can click on the image to see its full-size version:
I have built this chart using the ChannelPattern script. You can download my MetaTrader 4 chart template for this CAD/JPY pattern. You can trade it using my free Chart Pattern Helper EA.
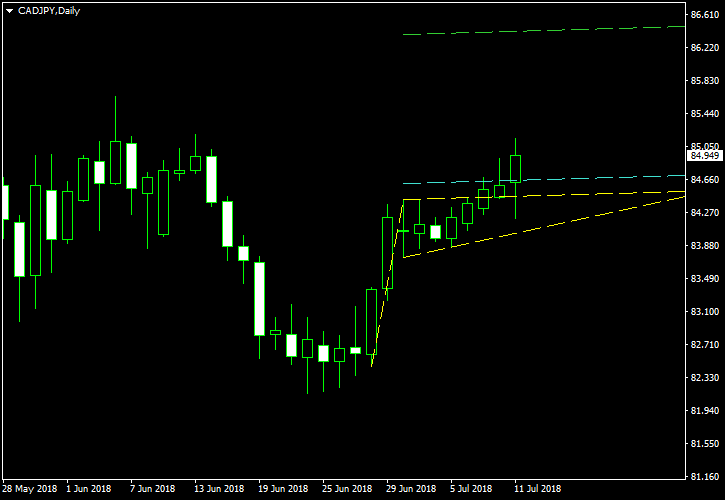
Update 2018-07-09 16:06 GMT: The currency pair managed to break out of the pennant, hitting my entry trigger at 13:44 GMT today. The open rate is 84.654 with a stop-loss at 84.262 and a take-profit at 86.412 (subject to gradual upward adjustments). The breakout was very shy and could definitely be a fakeout:

Update 2018-07-11: CAD/JPY has hit my stop-loss (84.262) at 01:00 GMT today:
If you have any questions or comments regarding this bullish pennant on the CAD/JPY chart, please feel free to submit them via the form below.