
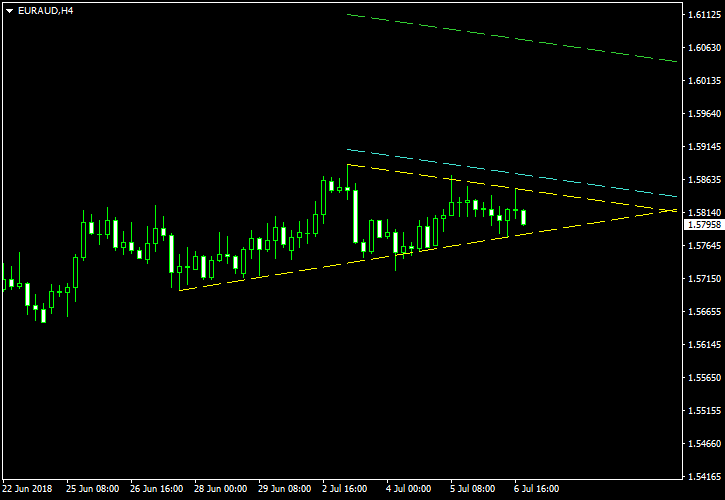
If you look at the four-hour chart of EUR/AUD, you can notice that the currency pair had spent roughly a month in an uptrend. The growth stalled near the end of June and has formed a rather smooth symmetrical triangle pattern since then. Such a classic continuation setup allows us to attempt catching a bullish breakout from the triangle.
The symmetrical triangle is marked with yellow borders. You can see a potential entry level (cyan line) positioned at 10% of the triangle’s base width above the upper border. The take-profit (green line) is located at 100% of the same distance above that border. My stop-loss will be set to the low of the breakout candle unless it is trading mainly outside of the borders; in that case, the preceding candle’s low will be used. I will ignore bearish breakouts as this symmetrical triangle follows a rally, not a downtrend. You can click on the image to see a full-size screenshot:
I have built this chart using the ChannelPattern script. You can download my MetaTrader 4 chart template for this EUR/AUD pattern. You can trade it using my free Chart Pattern Helper EA.
If you have any questions or comments regarding this symmetrical triangle on the EUR/AUD chart, please feel free to submit them via the form below.