
GBPUSD Price, News and Analysis
- White Paper will outline the UK’s future relationship with the EU
- UK PM May likely to come under further pressure from Tory rebel MPs.
- Sterling may come under further pressure unless BOE expectations harden.
IG Client Sentimentshows retail have been long of GBPUSD since April 20 when the pair traded around 1.4130, nearly 6.5% higher than the current spot price. Recent positional changes however give us a mixed trading bias.
GBPUSD Capped Around 1.3300 For Now
Prime Minister Theresa May will set out her vision for the future trading relationship between the UK and the EU in a controversial White Paper to be released today. The paper, the result of a fractious meeting at Chequers at the end of last week, has been dismissed by Brexit hardliners as being too ‘soft’ and has already sparked the resignation of UK Brexit negotiator David Davis and Foreign Secretary Boris Johnson and a handful of other junior ministers.And while the EU digests the document before making their response, PM May will remain under pressure from within her party with the very real possibility that rebel Brexiteers will call for a vote of no-confidence in the PM.
It is this political backdrop that is currently keeping GBPUSD capped below 1.3300, despite better-than-expected UK hard data of late and rising expectations of a UK rate hike at the next MPC meeting on August 2. Current market expectations for a 0.25% rate increase are around 60%. The market may get a signal on the central bank’s current thinking when BOE deputy governor Jon Cunliffe speaks on Friday at 11:00 GMT. Next week will also see the release of the latest UK employment, wages and inflation data which will provide more clarity on the UK economy.
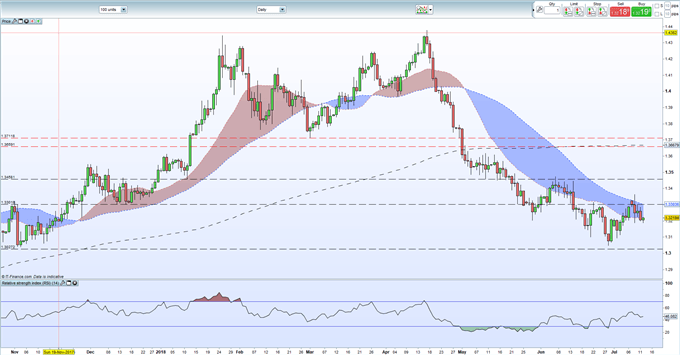
GBPUSD looks set to remain below 1.3300 in the short-term and may well test the recent 1.3050 low made on June 28 if the government implode. On the upside, the 50-day moving average kicks in at 1.33036, alongside a cluster of low trades made back in late-December 2017 which should also weigh on the British Pound. A break above this level and a close above 1.3363 should leave the way clear for a re-test of 1.3458.
We have just release our Q3 Trading Forecasts for a wide range of Currencies and Commodities, including GBP and USD.
GBPUSD Daily Price Chart (October 2017 – July 12, 2018)
DailyFX has a vast amount of updated resources to help traders make more informed decisions. These include a fully updated Economic Calendar, and a raft of Educational and Trading Guides
— Written by Nick Cawley, Analyst
To contact Nick, email him at nicholas.cawley@ig.com
Follow Nick on Twitter @nickcawley1