The Australian dollar versus the Canadian dollar currency pair bottomed at the 0.8900 psychological level and now rallies towards a bearish area.
Long-term perspective
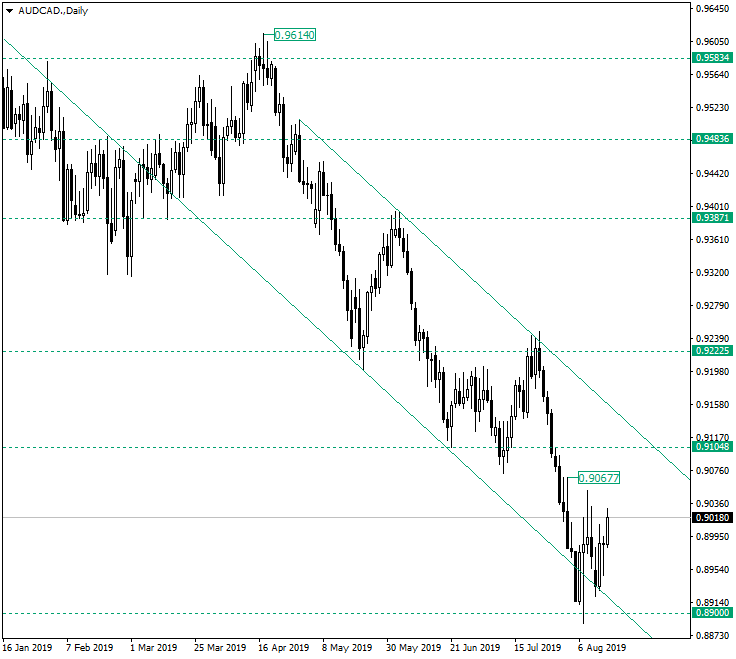
The drop that started from the confluence zone of 0.9222 with the upper line of the descending channel on July 23, 2019, managed to print a full-fledged impulsive wave that reached the weekly support of 0.8900. The latter, alongside the lower line of the descending channel, was a practical spot for the sellers to book their profits and for the aggressive buyers to enter the market, hence the retracement that took place.
In the aftermath of the retracement, the price carved an apparent bottoming structure with two lows — August 7 and August 12, 2019 — from which the second is a higher-low. So alter analyzing the lows, the conclusion can fairly be that a bottoming structure is in place, a double bottom respectively. Switching the attention to the highs, the 0.9067 high and the high of August 8, 2019, are descending and if joined, they can pinpoint a symmetrical triangle, which is a totally different story.
In case the pattern actually is a double bottom, the expectancy is for the price to continue the rally until the next important confluence area, represented by 0.9104 and the upper line of the descending channel. The confirmation of this area will translate into a new downwards leg that will target the 0.8800 psychological level. On the other hand, if the price does not find resistance in this confluence area, the path to 0.9222 is open.
However, if the market decides that the pattern is a symmetrical triangle, then further decline is to be expected. The more aggressive traders will short on any signs of weakness around the psychological level of 0.9000, targeting 0.8900 first and 0.8800 second. The conservative traders will wait for a break of the 0.8900 level to short, targeting the same 0.8800 psychological level.
Short-term perspective
The price managed to pierce 0.9000, but was stopped by the 38.2 Fibonacci retracement. If 38.2, alongside with the resistance line, is turned into a support, then the rally should take the price until the 0.9118 level which aligns with the 61.8 bearish last standing. In this case, a decline back to 38.2 is to be expected. If 61.8 gives way, the rally can revisit the 0.9238 level.
But if the price confirms the line and the 38.2 retracement, and goes beneath 0.9000, then 11.4 and 0.8900 are expected targets.
Levels to keep an eye on:
D1: 0.9000 0.9104 0.9222 0.8900 0.8800

H4: 0.9000 0.9118 0.8900 and the Fibonacci retracement levels, mainly 11.4 38.2 68.1 100.00
If you have any questions, comments, or opinions regarding the Technical Analysis, feel free to post them using the commentary form below.