The Australian dollar versus the US dollar currency pair rallied after touching the 0.6800 psychological level. Is this a sustainable bullish comeback, or it’s just the bears preparing further decline?
Long-term perspective
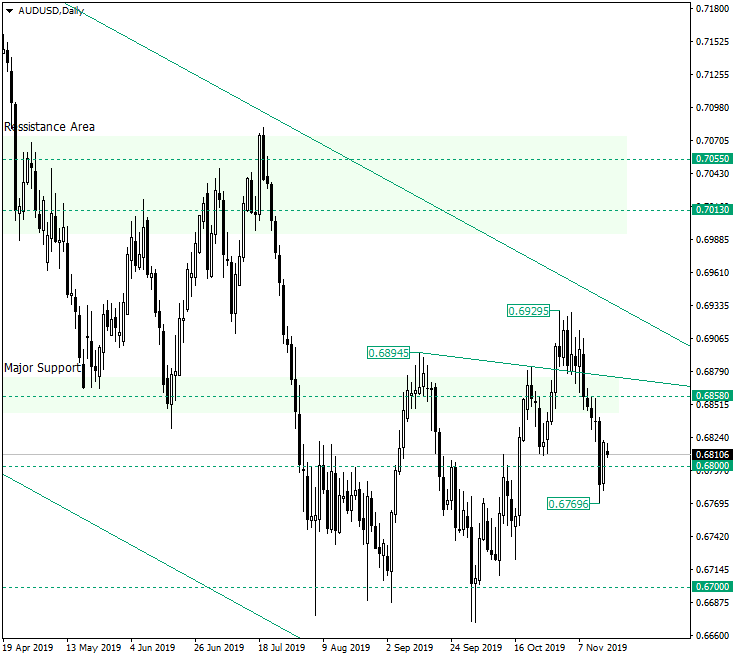
After bottoming around the 0.6700 psychological level, the price began an appreciation that pierced and confirmed 0.6800 as support, and then pierced but failed to confirm as support the 0.6858 level.
This failure led to a strong bearish enthusiasm which can be ascribed to the fact that it started after peaking at 0.6929, which is very close to the resistance trendline which pertains to the descending channel visible on the daily chart.
But the bears were stopped in their tracks by the 0.6800 psychological level after they managed to print a low at 0.6769. In other words, even if on November 14 they triumphed by closing the day under an important area, the next day invalidated their work by etching a piercing pattern.
On the other hand, this piercing pattern actually falsely pierced the 0.6800 support — see the low at 0.6769.
The patter in itself — and also its relation to the level — comes in a bullish context, one given by the bottoming structure that confirms 0.6700. This renders the unfolded events not as the beginning of a new bearish impulsive swing, but as the continuation of the work that the bulls kicked-off at 0.6700; simply put, the bulls are joining the market at better prices.
As a result, 0.7013 serves as the main target, with an intermediate one at 0.6900, that latter not being highlighted on the chart.
Short-term perspective
The price is in a depreciation that started after the confirmation of the 61.8 projection of the Fibonacci retracement as resistance.
It can be said that the depreciation had three phases. The first one is the flat limited by the support of 50.0 and the resistance of 61.8, the second one consists of the condensed area that stretches between 0.6855 and 38.2, and the third one is the plunge that touched 23.6 and that is being followed by a relatively strong retracement.
However, a trained eye matches the second and third phases with a bump and run bottom pattern. The aforementioned plunge corresponds to the “bump” phase, whereas the retracement that comes after is the “run” phase. And because it is a bottoming pattern, the expectations are for an appreciation to unleash — or to continue, if the rally from 23.6 is taken into account.
As a result, after the price pierces the resistance trendline of the pattern (and oscillates above 38.2), the next targets are 50.0 and 61.8, respectively.
Levels to keep an eye on:
D1: 0.6800 0.6858 0.7013 0.6900

H4: 0.6933 and the Fibonacci retracement projections of 38.2 50.0 61.8
If you have any questions, comments, or opinions regarding the US Dollar, feel free to post them using the commentary form below.