The Australian dollar versus the Japanese yen currency pair seems to have been conquered by the bears. Is it so or is it just a mirage?
Long-term perspective
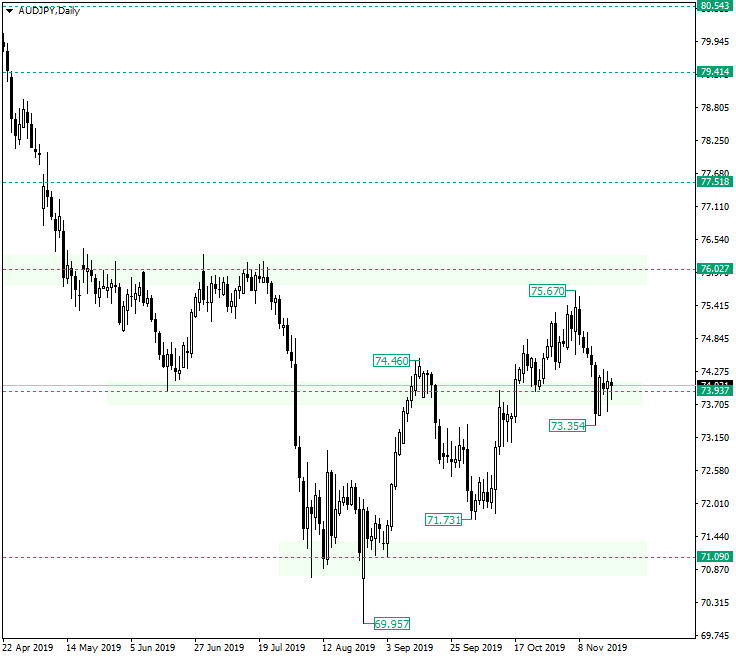
After the false piercing of the 71.09 support, the price began an appreciation that peaked at 75.67. From there, a downwards movement began, one that breached the 73.93 support and printed the low at 73.55.
The candle that came after the one that printed the low — that is November 15 — was bullish and, alongside the previous one, crystalized a piercing pattern.
Because the piercing pattern formed at an important support level — 73.93 — and in the context of an ascending trend — which started at 71.09 — the bulls have all the reasons to say that they are beginning to overpower the bears.
To all this, the November 19 pin-bar also is a fact that gives credit to the bulls, as the bearish attempt to drive prices down was repelled.
The only aspect that is not favoring the bulls is that, overall, the prices are falling — see 79.41. So, the ascending movement from 71.09 may be regarded as a pause from the bearish side, as they prepare further decline later on. If this is the case, any appreciation that starts from 73.93 will fail to make a new higher high with respect to 75.67.
But, for that to be possible, a bullish movement has to start in the first place. It can be considered that one would have started when the high of November 18 is taken out, and the price target in such an event is 76.02.
Only if the low of November 19 is taken out, then it can be said that the bears are still in control.
Short-term perspective
After confirming the 75.62 resistance, the price declined and printed a symmetrical triangle, a pattern which is classified as a continuation pattern — thus increasing the expectations for further decline to take place.
However, two factors can render this pattern as being already invalid. The first one is that the base of the triangle — the swing that connects with the left-ends of both resistance and support trendlines — is an exhaustive movement, meaning that the bears ran out of steam.
The second one is that the depreciation that precedes the triangle is a relatively short one, thus of lesser relevance.
So, if the support trendline of the triangle is pierced, then 73.10 is in reach. On the other hand, if it is confirmed as support, alongside with 73.90, then 74.96 is the next target.
Levels to keep an eye on:
D1: 73.93 76.02

H4: 73.90 73.10 74.96
If you have any questions, comments, or opinions regarding the Technical Analysis, feel free to post them using the commentary form below.