The New Zealand dollar versus the Canadian dollar currency pair surprised the market by turning around. Is there any chance of a comeback?
Long-term perspective
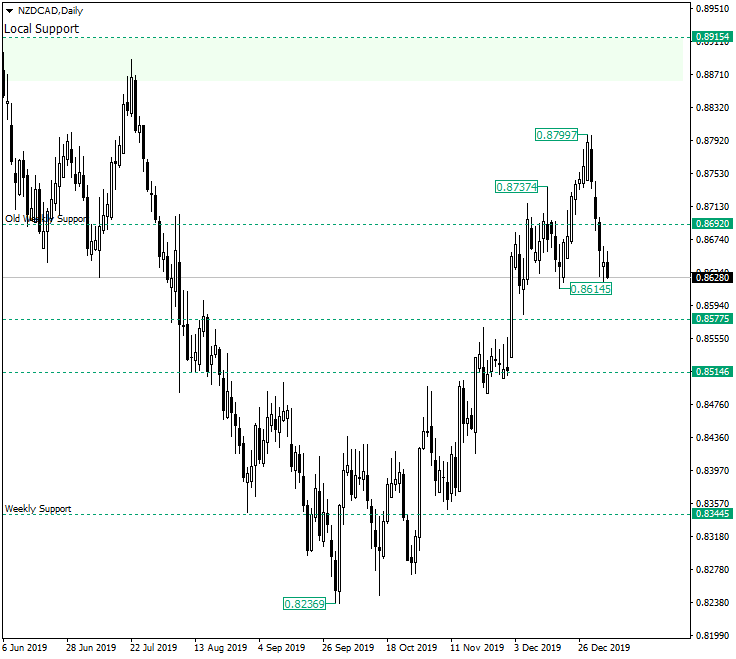
After confirming the weekly support of 0.8344, the price appreciated in a very convincing manner, managing to cross important levels, including 0.8692 — which is an old but important support level.
Unfortunately for the bulls, the price was not able to maintain itself above the 0.8692 level, as after it peaked at 0.8799 it declined back under it.
Even better for the bears, the depreciation began with a bearish engulfing pattern, printed by the candles on December 30 and 31, respectively.
This boosts the bearish morale sufficiently enough in order for them to think that they may very well start a convinced descending trend.
It is possible that this process already commenced, as the high of 0.8737 could be the left-side shoulder and the peak of 0.8799 the head of what can become a head and shoulders pattern. In other words, major trends start with a strong trend-changing chart pattern. The head and shoulders pattern is one of them.
Of course, as the pattern is not complete, the scenario of a descending trend cannot be taken into account yet. However, the possibility of the situation evolving in the direction in which a head and shoulders pattern does form is real.
If the price appreciates and reaches the 0.8692 level, but is not able to confirm it as support, then, most likely, another downwards wave will be drawn, thus unveiling the right-side shoulder.
Aggressive traders will be looking to short the market at the 0.8692 level, whereas the conservative ones will prefer to wait for the neckline of the pattern to be pierced and confirmed as resistance. The target for these two scenarios is represented by 0.8514.
Only if the price is stooped in its tracks at 0.8577, then the bearish scenario might be postponed or even invalidated.
Short-term perspective
The price is contained within a flat limited by the 0.8716 resistance and the 0.8600 support area.
The fact that the price, after it pierced the resistance, extended until 0.8782 but was not able to sustain its gains, gives credit to the bears. This means that any appreciation can be seen by the bears as an opportunity to short at better prices.
As a consequence, if 0.8667 is falsely pierced, thus maintaining its role as a resistance, then further depreciation may be seen. The depreciation targets 0.8516.
Only if 0.8600 gets falsely pierced or if 0.8667 confirmed as support, then a revisit to 0.8716 is in the cards, the level also serving as a profit booking area.
Levels to keep an eye on:
D1: 0.8692 0.8514 0.8577

H4: 0.8667 0.8514 0.8600 0.8716
If you have any questions, comments, or opinions regarding the Technical Analysis, feel free to post them using the commentary form below.