The United States dollar versus the Japanese yen currency pair, at first glance, seems to be in bullish hands. But is it so?
Long-term perspective
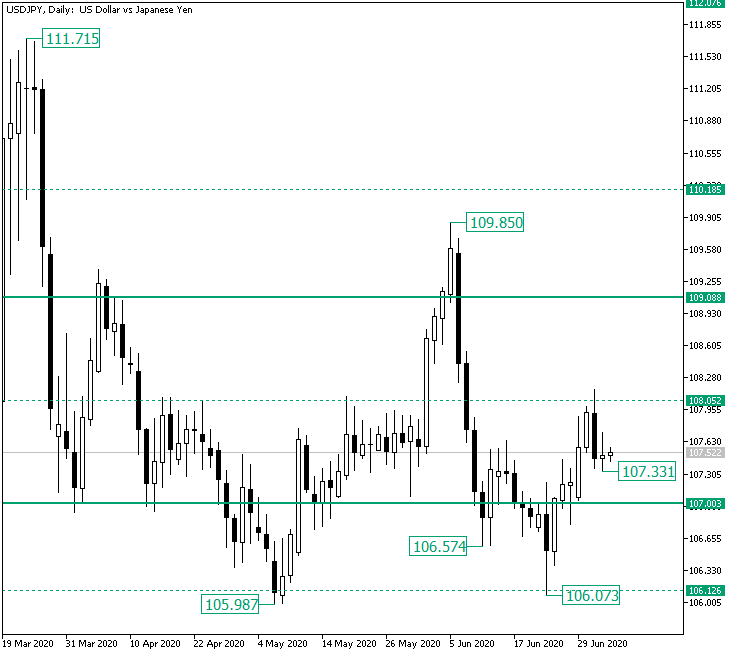
The fall that started from the 109.85 high extended, in a primary phase, until the 106.57 firm level, being rejected by its supportive role. However, the bears continued pressuring the price, thus drawing another leg down and etching the 106.07 low.
Since 106.07 is very close to the previous one, at 105.98, and because the latter one had the power to turn around the drop that followed the confirmation of 107.00 as resistance on April 20, the 106.07 area stayed packed with bulls, as it can be seen from the strong rejection and the appreciation that brought the price above the 107.00 psychological level and around the 108.05 intermediary level.
Now, by considering the lows on the chart, one can see the 106.57 as the first shoulder and the low of 106.07 as the head of a head and shoulders pattern that might have its second shoulder at the 107.33 low and the neckline at 108.05.
If this is the case, then the bulls might expect that an appreciation should be in the cards. It may come without printing a lower low, with respect to 107.33, or with a retracement that validates 107.00 as support and defines the second shoulder in the process. In this scenario, 108.05 is a partial profit booking area, while the main bullish goal sits at 109.08.
On the other hand, the bearish engulfing from 108.05 spells a heavy possible depreciation. By checking the chart, it can be seen that the 108.05 level is, although an intermediary one, also an important one, serving as a good reference point for different past movements. So, the drop signaled by the candlestick pattern could fulfill itself but be limited by the 107.00 level, which in turn triggers the aforementioned bullish scenario, or it can be that strong that it pierces 107.00 and leads the price once more to 106.12.
Short-term perspective
After almost touching the important 106.02 support level, the price started an appreciation highlighted by the ascending trendline.
Even if the bulls managed to conquer the 106.77 and 107.34 intermediary levels, the tough resistance of 108.02 limited further progress and sent the price beneath the ascending trendline, casting the end — or at least a pause — of its corresponding trend.
This drop stopped at 107.34, so as long as the level plays out as support, the bulls could try to drive the prices higher. Even so, as 108.02 serves as a first stop, it could also be an area that facilitates the formation of a topping pattern. Considering that, if 107.34 gets breached, then 106.77 comes as a first bearish target, followed by 106.02.
Only if 108.02 is cleared, then the bulls could extend until 108.53 and, later on, to 109.27 and 109.66.
Levels to keep an eye on:
D1: 107.00 108.05 109.08 106.12

H4: 107.34 108.02 106.77 106.02 109.27 109.66
If you have any questions, comments, or opinions regarding the US Dollar, feel free to post them using the commentary form below.