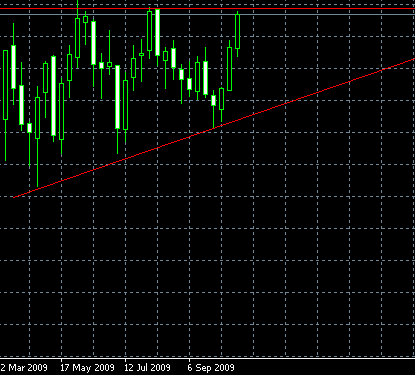
The latest trend development on the EUR/JPY currency pair’s weekly timeframe chart shows a strong resistance level formed near 138.56 with a support level being sloped under a rather small angle to this resistance. Thus the ascending triangle chart pattern is formed on EUR/JPY. The pattern looks almost perfect but the problem is that the apex of the triangle is very far away in time, which signals of a pattern’s weakness. Anyway, my recommendation is to buy EUR/JPY when the price closes above the upper resistance level on a weekly timeframe. You can click the image below to get the full picture of the pattern:

If you have any questions or comments regarding this EUR/JPY chart pattern, please, feel free to reply via the form below.