
GBP/JPY has formed a pattern that looks like a double bottom on its weekly Forex chart. It ends the descending trend wave that has started back in August 2009, which itself is a part of the longer downtrend with beginning in July 2007. The pattern isn’t perfect — the second bottom isn’t exactly on the same horizontal line as the first one, and the price haven’t rose to the initial point of the pattern yet, so it may still form symmetrical triangles, a continuation pattern. But, nonetheless, it’s a good a setup if you don’t jump into a trade right away.
I use the horizontal channel setup as the entry/exit system for this double bottom pattern. The borders of the “channel” are marked with the yellow lines on the image below. The entry points (cyan lines) are located at +/-10% of the “channel’s” height. Green lines show the probable targets of the breakout trades — they are located at +/-100% of the “channel’s” height.
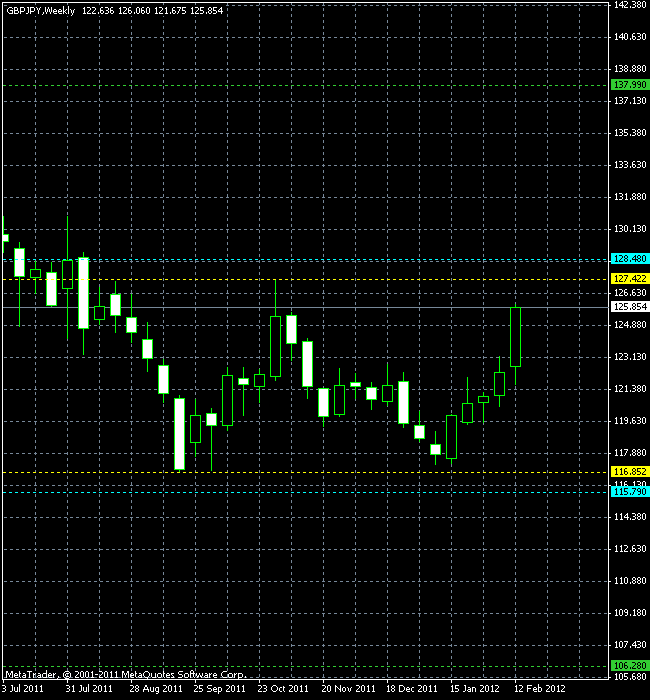
Update 2012-02-24: Buy order triggered at 128.48 with the
Update 2012-05-17: After a long period of profitable trading, the position has been closed at 125.38 (8 pips below the initial
If you have any questions or comments regarding this GBP/JPY chart pattern, please feel free to reply via the form below.