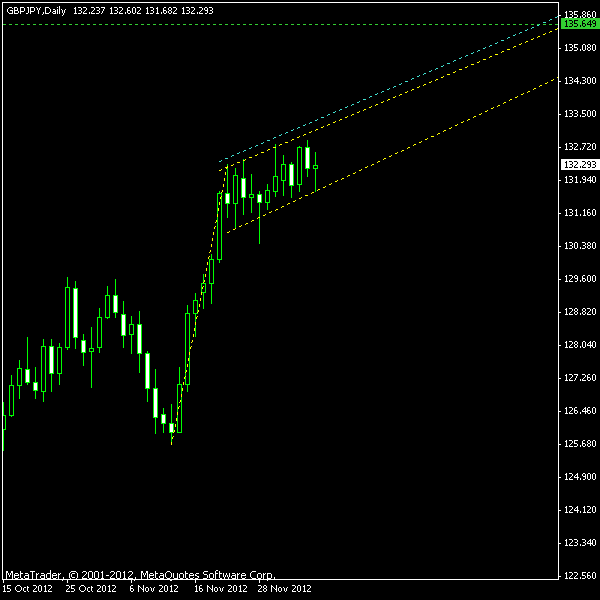
Daily charts of two JPY currency pairs now feature distinct bullish flag patterns that usually precede an uptrend continuation. The first pair is USD/JPY, where consolidation phase resembles a horizontal channel and is already 12 trading days long. The second pair is GBP/JPY. Its flag part is 13 trading days old and is tilted up significantly (which is a rather bad feature). A flag pattern is considered to be of a good quality when consolidation phase lasts at least three weeks before breaking out.
As you can see on the image below, the yellow lines mark the whole pattern — the flag and its pole. Cyan line is placed at 10% of flag’s width above the upper border since only bullish breakout is traded with this pattern. It marks the entry point. A green line is a probable profit target placed at the recent price peak.

You can also download my MetaTrader 4 chart template for this USD/JPY pattern.
The same colors are used for GBP/JPY. Yellow lines mark the pattern, while the cyan line is a breakout entry point. Green line is placed at 50% of flag pole’s height above as a rather conservative level for

You can also download my MetaTrader 4 chart template for this GBP/JPY pattern.
In both cases, I would use the breakout bar’s low as the
Update 2012-12-12 14:05 GMT: Both long positions entered at about 8:50 GMT today. USD/JPY entry was at 82.92 with SL at 82.48 and TP at 84.17. GBP/JPY entry was at 133.62 with SL at 132.84 and TP at 135.65.
Update 2012-12-12 7:28 GMT: Thanks to the huge weekend gap on JPY pairs, both USD/JPY and GBP/JPY positions were closed with profit today. Unfortunately, my broker decided to close them at the initial
If you have any questions or comments regarding these bullish flags on USD/JPY and GBP/JPY charts, please feel free to post them via the form below.