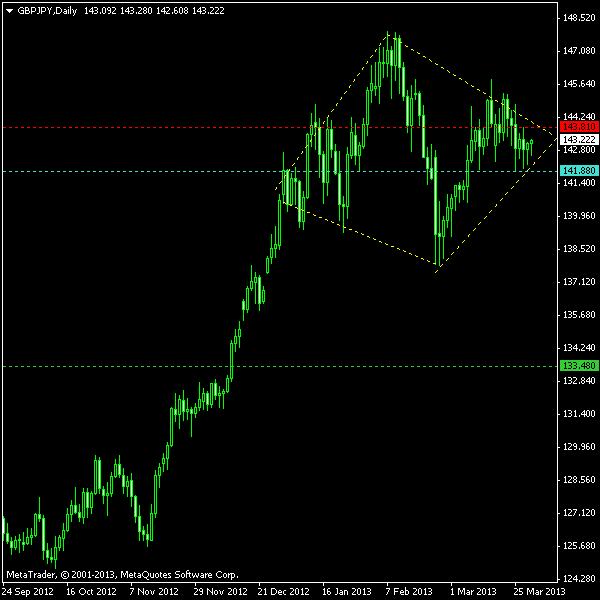
It is the first time I write about a diamond top/bottom formation, though I have mentioned diamond in my Forex chart patterns overview. This one looks so obvious to me that I have thought that it is time to try out something new. This GBP/JPY instance on a daily chart is a nearly perfect example of a diamond top pattern. It is slightly sloped, but otherwise it fits well. It is also
The image below shows the pattern marked with yellow dashed lines. Since diamond top is a reversal pattern, only a bearish breakout is considered. Cyan line marks my entry level, which is simply based on the minor support level. As my usual rules for trading chart pattern do not work with diamonds, I put my target (green line) near the next major support level close to the “launching site” for a rally, which predated the pattern formation. I set my

You can download my MetaTrader 4 chart template for this GBP/JPY pattern.
You can read more about trading diamond tops on Thomas Bulkowski’s site.
Update 2013-04-01 7:52 GMT: Sell position opened at 141.88 at 7:26 GMT.
Update 2013-04-04 8:16 GMT:
Update 2013-04-13 10:29 GMT: By the way, even though the pattern failed at a reversal breakout, it managed to act as a
If you have any questions or comments regarding this diamond top on GBP/JPY chart, please feel free to submit them via the form below.