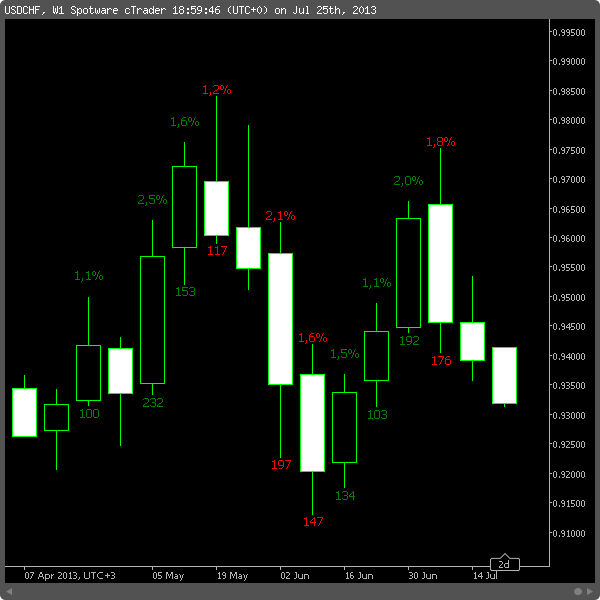
Gain/Loss Info is the newly available free indicator. It is not a trading indicator — it is more like an analytical one. Although the title says about measuring weekly and daily changes, it will actually measure changes per candle (or from previous Close to next candle’s Close) on any timeframe. Of course, its main purpose is to show percentage gains for days, weeks and months as they can really provide some meaningful information to a trader.
One of the main features is that you can set a limit value, which will be used as a threshold — if change for a period is lower, it will not be shown. This will help you to avoid a lot of chart clatter, but at the same time will help you find significant changes in price history.
You will not be able to get some clear trading signals from Gain/Loss Info, but once it shows you the change values, you will have valuable information about currency pair’s (or any other asset’s) behavior. Was the last week the biggest gain in a decade? Is the size of the percentage drop going down with each week in the current bearish rally? Gain/Loss Info can help you answer questions such as these.

You can download the MT5 or MT4 version, or read Gain/Loss Info about this price gain/loss indicator. Gain/Loss Info is also available for  .
.
If you find any bugs in this technical indicator or if you have some feature suggestions, please post about it using the commentary form below.