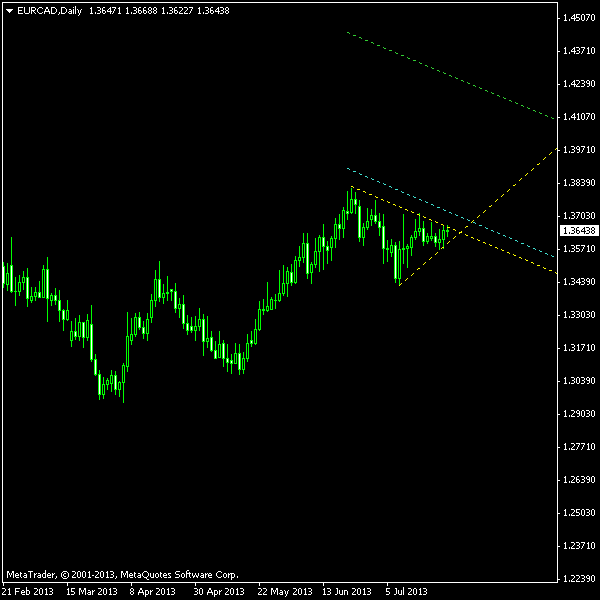
Since the time of the previous important EUR/CAD pattern (descending channel) the pattern had risen significantly and then formed a kind of symmetrical triangle. It is not a very clean Forex
According to the chart below, there is no lack of upper border touches. The lower border is less significant but has two points to form a sort of triangle. This pattern is a continuation one and considering the previous uptrend, only bullish breakout will be used for trading here. The potential entry levels are depicted with cyan line. The green line shows

You can download my MetaTrader 4 chart template for this EUR/CAD pattern. It can be traded using my free Chart Pattern Helper EA.
Update 2013-07-30 4:36 GMT: Pending order canceled as the price has gone through the apex without triggering a breakout.
If you have any questions or comments regarding this symmetrical triangle on CHF/JPY chart, please feel free to submit them via the form below.