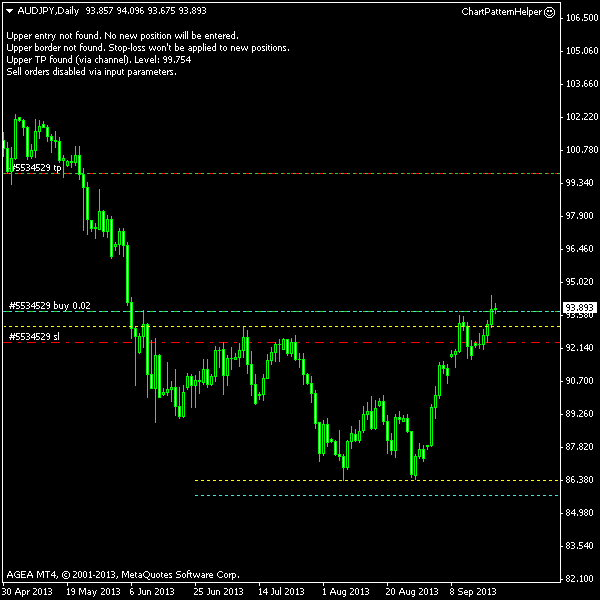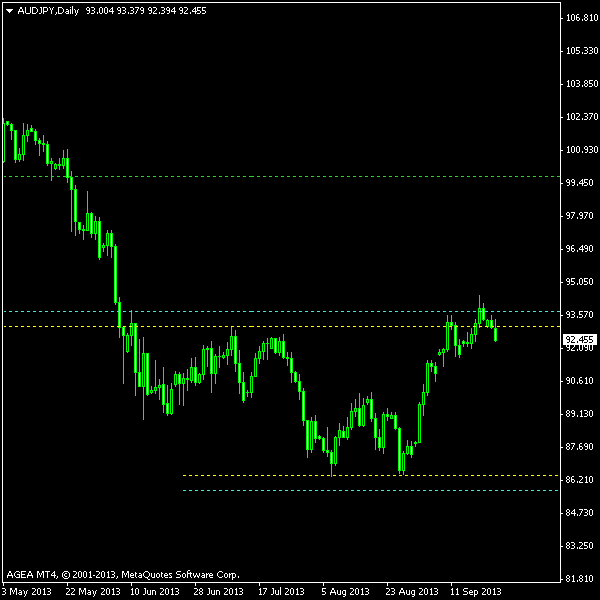
If you look at the daily AUD/JPY Forex chart, you will easily notice a rather strong downtrend lasting since the peak of April 11, 2013. Although the drop has slowed down in June, the currency pair proceeded to make new lower lows in early August, hitting the same low at the end of the month. As a result, traders can now observe a nearly perfect double bottom formation that is yet to confirm itself by rising above the highs of July failed recovery.
The pattern, as it is marked on the image below, represents a kind of unfinished rectangle formation. Nevertheless, I will trade it as a double bottom unless a significant confirmation of the upper border is shown by the price. My buy entry order is positioned at the cyan line — 10% of the rectangle’s height above the upper border (yellow line). I will take profit at the green line, which is located at 100% of the rectangle’s height above the border. As usually, I will utilize the breakout bar’s low as my

You can download my MetaTrader 4 chart template for this AUD/JPY pattern. It can be traded using my free Chart Pattern Helper EA. I will set DisableSellOrders to true as I am not going to trade the bearish breakout unless the pattern confirms itself as a rectangle. I will also set Magic to something different from the one I use on the previous AUD/JPY pattern for the MT4 not to confuse the trading orders.
Update 2013-09-20 16:06 GMT: Entered long position at 07:08 GMT yesterday. The entry price is 93.777,

Update 2013-09-24 14:38 GMT: Exited at

If you have any questions or comments regarding this double bottom on AUD/JPY chart, please feel free to submit them via the form below.