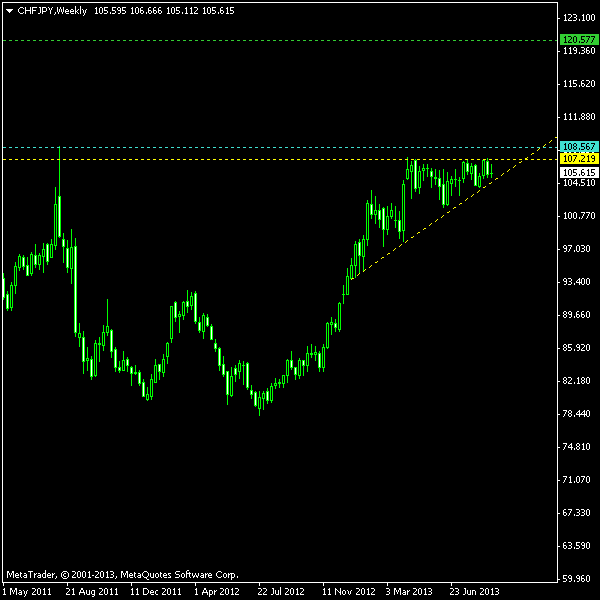
Long-Term Ascending Triangle on CHF/JPY

Being a huge fan of the 
long-EUR/CHF-thanks-to-SNB trading, I still recognize some technical trading opportunities presented by various Swiss franc currency pairs. The current long-term uptrend on CHF/JPY weekly chart is already lasting for more than a year and is based mostly on yen’s weakness rather than on Swissie’s strength. Stagnation and failure to post new higher highs since April is a classical case of an ascending triangle from the technical analysis point of view. Such patterns tend to lead to continuation of the previous trend following a breakout from the consolidation area.
The triangle’s borders are shown with the yellow lines on the chart below. Since only bullish breakout will be considered here, both entry and TP lines are positioned only above the border. The distance for the them is based on the height of the triangle’s vertical side. Coincidentally, the entry level is placed near the all-time high set in August 2011 just before the SNB intervention. I will set my stop-loss to the breakout bar’s low or to the previous bar’s low if the breakout bar will trade mostly outside the triangle. Please click on the image below to see the full-sized screenshot of the chart:

You can download my MetaTrader 4 chart template for this CHF/JPY pattern. It can be traded using my free Chart Pattern Helper EA.
Update 2013-09-20 16:14 GMT: Buy order triggered at 108.593 at 07:55 GMT today. Stop-loss is currently set to 105.956, take-profit — at 120.577. The breakout still looks quite strong. Post-entry chart:
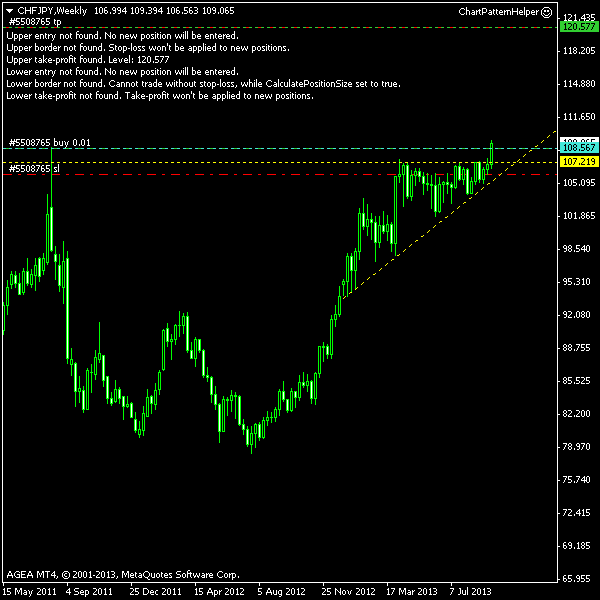
Update 2014-07-21 12:40 GMT: I have closed this long-term CHF/JPY trade today at 112.771 with some minor profit. I saw no reason to hold it for longer as the chart has clearly traded its way out of the initial chart pattern:


If you have any questions or comments regarding this ascending triangle on CHF/JPY chart, please feel free to submit them via the form below.

Leave a Reply

Your email address will not be published. Required fields are marked *

two + 3 =