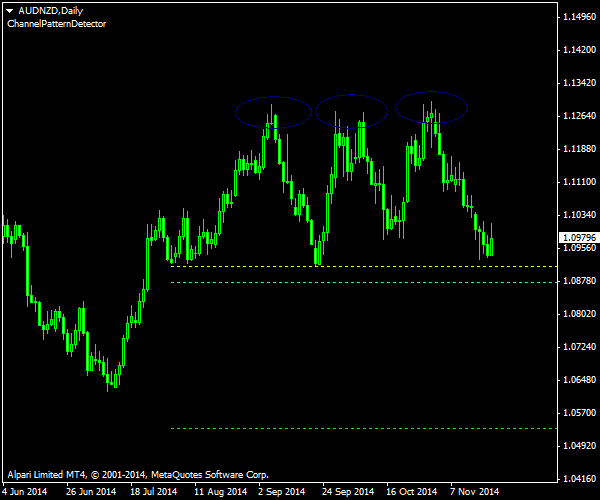
A notable triple top pattern appears on a daily chart of the AUD/NZD currency pair. You can see it at the end of the
The pattern is marked with three dark blue circles on the image below. A horizontal yellow line shows the lower border (neckline). The pattern’s entry level is positioned after a buffer range below the border. Entry level is based on the height the triple top formation. It is also not far from the

The channel was detected using the Channel Pattern Detector indicator. The chart was built using the ChannelPattern script. You can download my MetaTrader 4 chart template for this AUD/NZD pattern. It can be traded using my free Chart Pattern Helper EA.
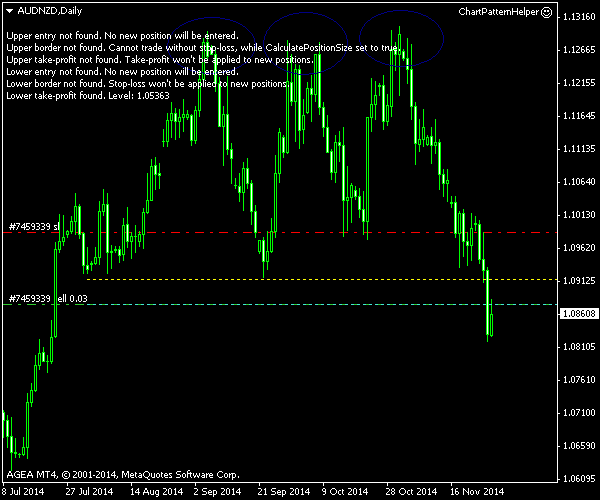
Update 2014-11-27: Entered a short position at 1.08771 yesterday. The

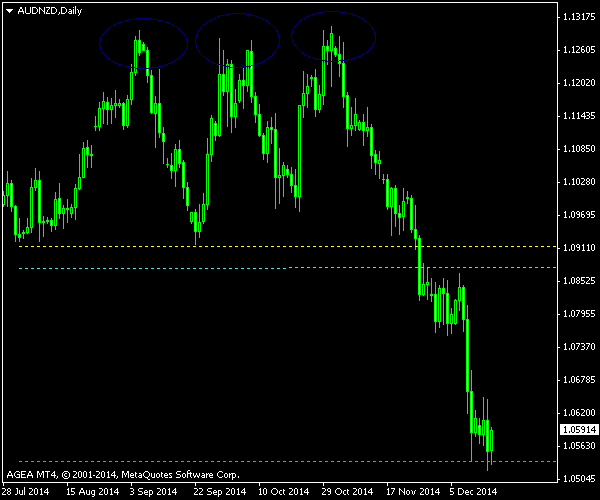
Update 2014-12-17: The trade has hit its

If you have any questions or comments regarding this triple top on AUD/NZD chart, please feel free to submit them via the form below.