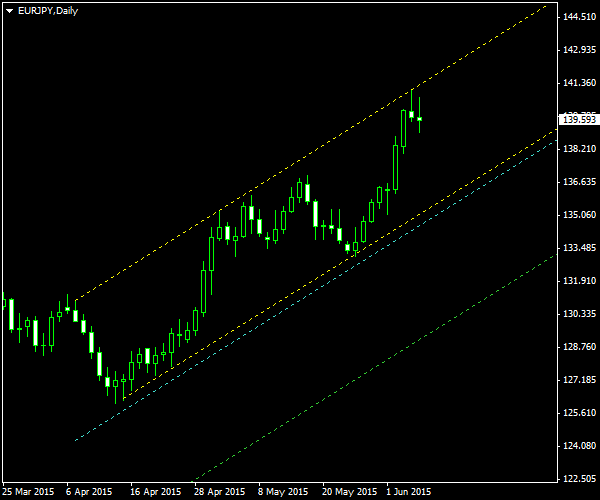
The rising channel pattern that is now so evident on the EUR/JPY D1 chart has began forming two months ago. Basically, the channel is a correction wave of the major bearish trend that lasted since early December 2014 till April 2015. The borders of the channel are based on multiple daily highs and lows and appear valid.
You can see the borders of the ascending channel depicted with the yellow lines on the chart below. The cyan line shows a bearish breakout entry point and is located at 10% of the channel’s height below the bottom border. The green line is a

The channel was detected using the Channel Pattern Detector indicator. The chart was built using the ChannelPattern script. You can download my MetaTrader 4 chart template for this EUR/JPY pattern. It can be traded using my free Chart Pattern Helper EA.
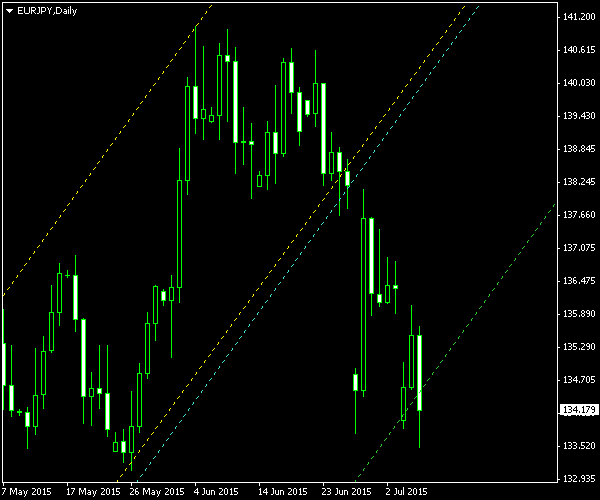
Update 2015-06-26: The breakout entry has been triggered yesterday in the morning. The open price is 137.943 with

Update 2015-07-07 18:24 GMT: Thanks to Greece, the trade has hit its

If you have any questions or comments regarding this ascending channel on EUR/JPY chart, please feel free to submit them via the form below.