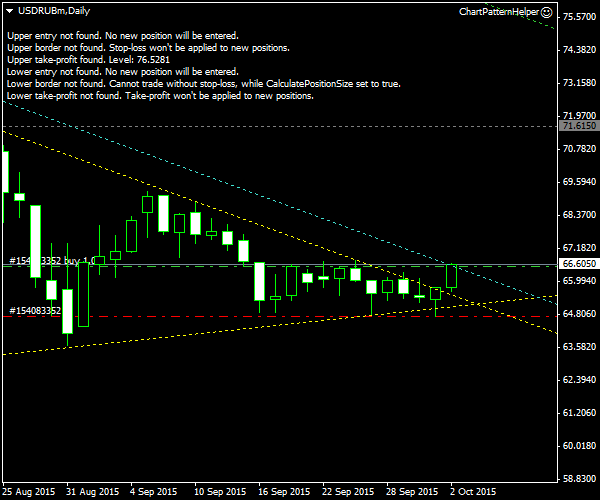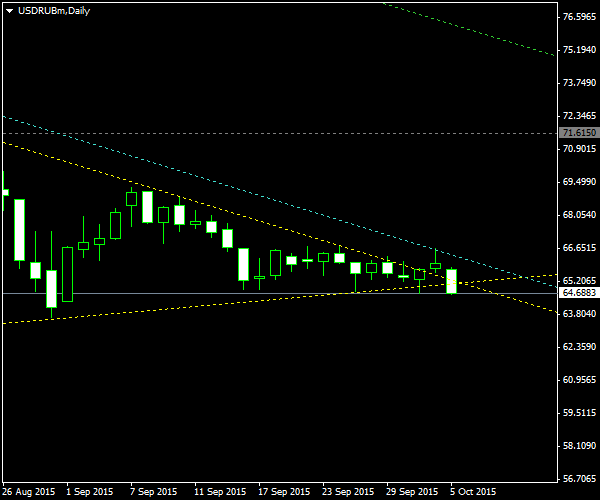
Russian ruble has been consolidating in a symmetrical triangle pattern since late August. USD/RUB reached its most recent peak on the daily chart on August 24 (71.60). The formation of the pattern went by the book except for the upper border declining faster than the lower border is rising. This instance of symmetrical triangle follows a rather long uptrend and represents a classic continuation pattern. The bullish breakout looks imminent.
The yellow lines on the chart below mark the triangle pattern’s borders. The declining cyan line offers a buffered entry level for the upward breakout trade. The green line, which is also declining, is the optimistic profit target based on the triangle’s size. The horizontal gray line is placed at the strong resistance level formed by the August and January peaks. It can serve as a conservative

The chart was built with the help of ChannelPattern script. You can download my MetaTrader 4 chart template for this USD/RUB pattern. It can be traded using my free Chart Pattern Helper EA.
Update 2015-10-02 13:34 GMT: The buy order triggered just half an hour ago at 66.5469. The

Update 2015-10-05 14:25 GMT: The situation deteriorated quickly. The position has hit

If you have any questions or comments regarding this symmetrical triangle on USD/RUB chart, please feel free to submit them via the form below.