Breaking News
- December 21, 2020 Do we get tax benefits on Personal Loan?
- December 18, 2020 The solicitors Preston depends on for stress-free compensation claims
- December 16, 2020 eToro: History and Key Features
- December 11, 2020 Canadian Dollar Pauses 2020 Rally Against US Peer Amid Falling Crude Prices
- December 11, 2020 Pound Crashes Against Dollar As No-Deal Brexit Appears Imminent
- December 11, 2020 USD/JPY 104.57 High Starting a New Bearish Leg?
Day: February 7, 2016
 February 7
2016
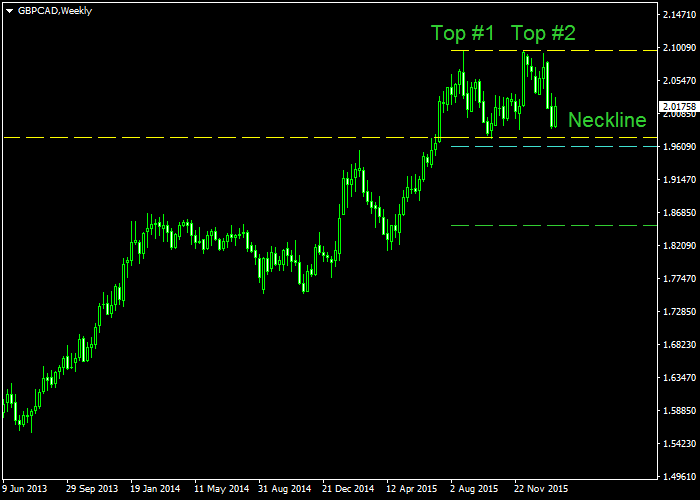
Disfigured Double Top on GBP/CAD Weekly Chart
Not all chart patterns are created to look like an ideal example — some of them look horribly despite meeting the formal requirements of their kind. The latest development on GBP/CAD weekly chart is just such a case. The pattern began forming back in July 2015. The first top was reached in the end of August, then the middle bottom was set in October. The second part peaked in December 2015 but has also […]
Read more