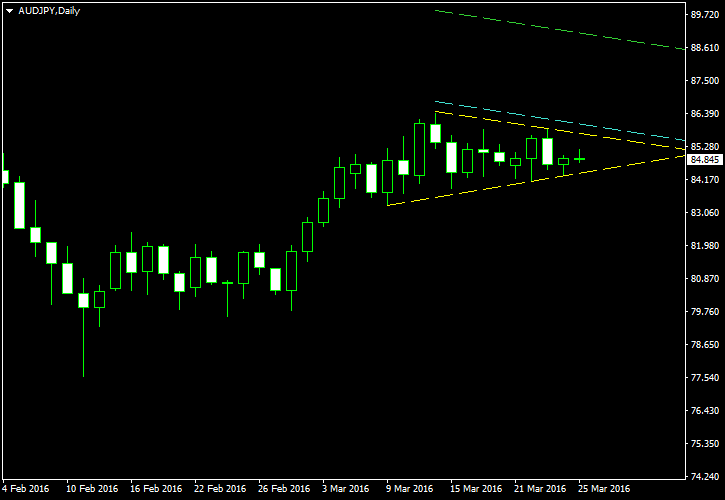
Normally, symmetrical triangles follow strong directed movement. They represent consolidation before a continuation of the trend. This time, the daily chart of AUD/JPY is demonstrating a
The triangle’s borders are marked with the yellow lines on the image below. The cyan line is my entry level located at 10% of the triangle’s width (at the base) from the upper border. The green line is my

I have built this chart using the ChannelPattern script. You can download my MetaTrader 4 chart template for this AUD/JPY pattern. You can trade it using my free Chart Pattern Helper EA.
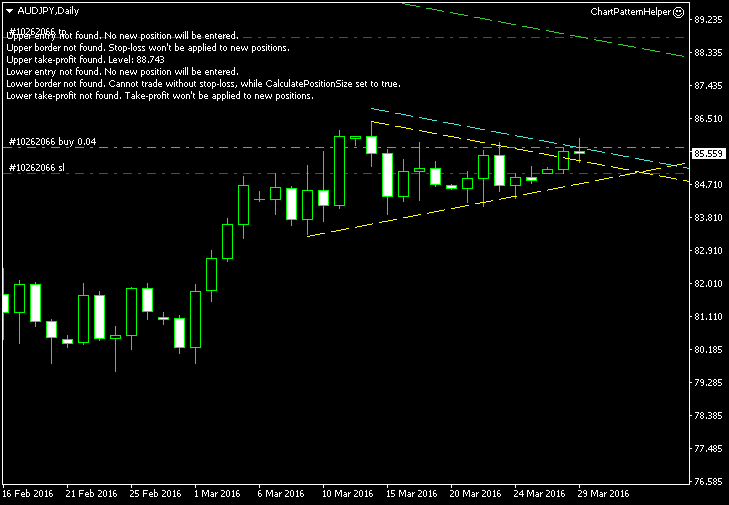
Update 2016-03-29 11:05 GMT: Long entry triggered today on cyan line breakout at 00:20 GMT. The open price is 85.718,

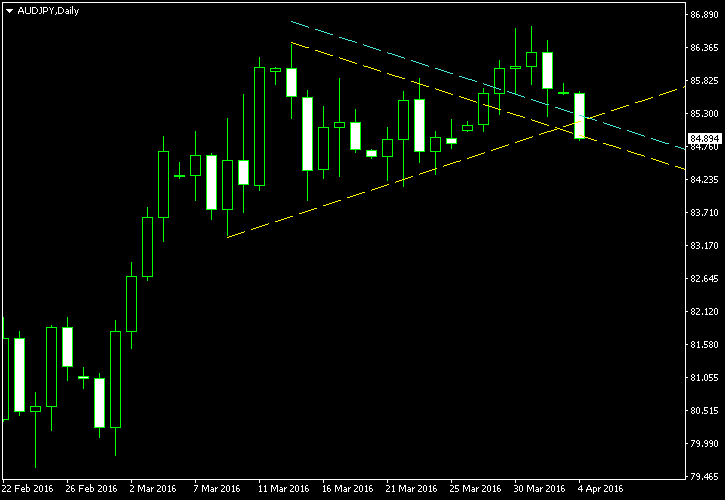
Update 2016-04-04 6:40 GMT: The trade has hit its

If you have any questions or comments regarding this symmetrical triangle on AUD/JPY chart, please feel free to submit them via the form below.