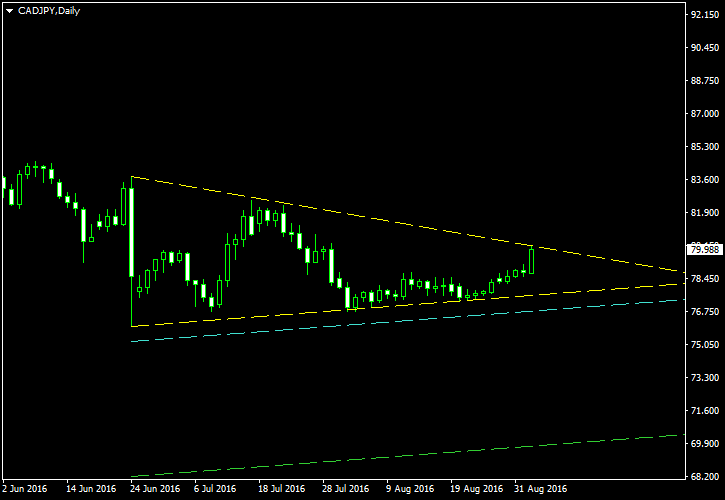
CAD/JPY Consolidates in Symmetrical Triangle on Daily Timeframe

Canadian dollar is in a long-term downtrend against the Japanese yen since December 2014. The current bearish wave runs since April this year. The currency pair is consolidating for more than two months as of today. A bearish breakout from the formed triangle will trigger further selling pressure against the CAD.
The symmetrical triangle is marked with the yellow lines on the screenshot below. As you can see, it is quite smooth, albeit not ideally symmetrical. The trade’s entry level can be placed at the cyan line — the 10% buffer for a breakout. The green line can serve as a selling target — it is placed at 100% of the triangle’s width at the base from the lower border. I will set my stop-loss to the high of the breakout candle or to the the high of the previous candle if the breakout one will be positioned mostly outside of the pattern. Symmetrical triangle is a continuation pattern, so I will not be taking a bullish breakout trade here. You can click on the image to see a bigger version of the chart:

I have built this chart using the ChannelPattern script. You can download my MetaTrader 4 chart template for this CAD/JPY pattern. You can trade it using my free Chart Pattern Helper EA.
Update 2016-09-16 12:20 GMT: CAD/JPY has finally triggered my short entry at 77.086 today at 10:57 GMT. With stop-loss at 78.630 and take-profit at 70.077, the potential risk-to-reward ratio seems very attractive. Now is the waiting time:

Update 2016-10-05 16:39 GMT: The trade has hit its stop-loss half an hour ago:

If you have any questions or comments regarding this symmetrical triangle on CAD/JPY chart, please feel free to submit them via the form below.

Leave a Reply

Your email address will not be published. Required fields are marked *

sixty four − fifty four =