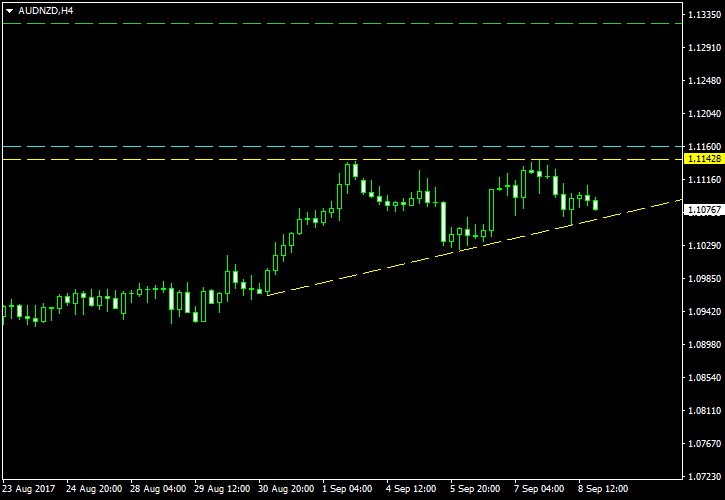
The current AUD/NZD uptrend is traced back to June 26. It was interrupted by just one significant consolidation before — back in late July. The current ascending triangle on the 4-hour timeframe is a classic example of such patterns with a horizontal resistance level and a
The triangle is delimited with the yellow lines on the image below. The cyan line marks my potential entry point and is positioned at 10% of the triangle’s height (at base) above the upper border. The green line is placed at 100% of the same distance and will serve as my

I have built this chart using the ChannelPattern script. You can download my MetaTrader 4 chart template for this AUD/NZD pattern. You can trade it using my free Chart Pattern Helper EA.
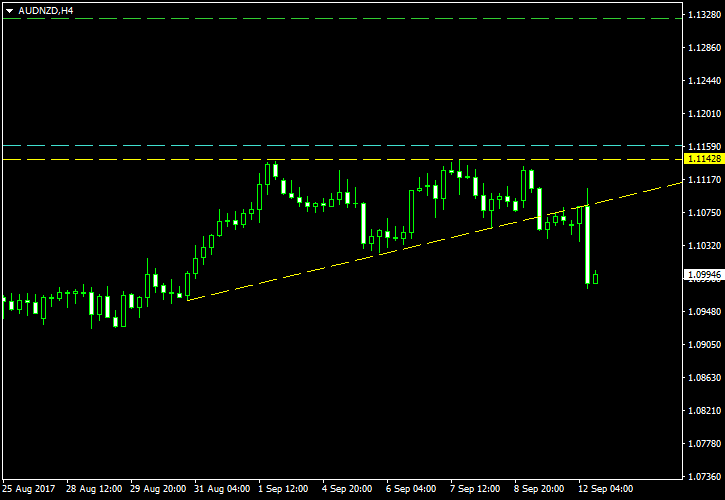
Update 2017-09-12: I have cancelled this trade setup because the triangle had been broken to the downside invalidating the original continuation pattern:

If you have any questions or comments regarding this ascending triangle on AUD/NZD chart, please feel free to submit them via the form below.