Talking Points:
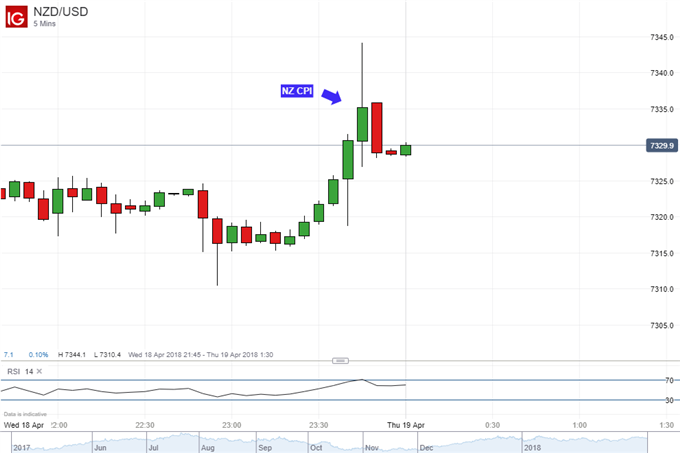
- New Zealand Dollar slightly higher after a mostly in-line local CPI report
- Data was in-line with RBNZ estimates, focus turns to risk trends and Fed
- NZD/USD fell as expected as upside momentum declined, more to come?
Just getting started trading the New Zealand Dollar? See our beginners’ guide for FX traders to learn how you can apply this in your strategy!
The New Zealand Dollar showed a bittersweet response to a mostly in-line local CPI report. In the first quarter, the island nation’s headline inflation rate was +1.1% y/y in the first quarter, as expected. This is down from +1.6% in the fourth quarter and is the slowest pace of price growth since the third quarter of 2016. Meanwhile, the quarter-on-quarter CPI rate was slightly higher at +0.5% versus +0.4% expected.
Even though the country is experiencing some disinflation, it should come as no surprise to the Reserve Bank of New Zealand. At its most recent monetary policy announcement, the central bank projected weaker price growth in the near-term. But, longer-term expectations are still anchored at 2.0%. In addition, RBNZ’s new Governor Adrian Orr said that they expect very “benign” inflation going forward before the data release.
All this seems to make today’s inflation report, while soft when looking at a historical prospective, in line with what the central bank expects. The tradables and non-tradables aspect of the CPI report were also heading in the direction of their forecasts. This might have been why the Kiwi Dollar showed a relatively positive response to the data, but not in a very pronounced way.
With that in mind and critical event risk now behind us, looking ahead the New Zealand Dollar will probably find itself continuing to focus on risk trends. Lately, it has actually been inversely tracking the similar-yielding US Dollar. On Wednesday, the Kiwi Dollar actually spent some time declining as the S&P 500 rose while the greenback benefited. Keep an eye out for some Fed speak on Thursday, Lael Brainard has one at 12:00 GMT.

NZD/USD Technical Analysis: Tipping Over?
On a daily chart, NZD/USD declined as expected after the emergence of negative RSI divergence. However, it was also held up by near-term support which appears to be the 23.6% Fibonacci extension at 0.7308. A push below this area will not only expose the 14.6% minor level at 0.7249, but also may invalidate the falling wedge bullish reversal pattern. If prices turn higher, immediate resistance may be the 38.2% level at 0.7404. A push above that will expose September 2017 resistance which has now been tested three times.

NZD/USD Trading Resources:
- Join a free Q&A webinar and have your trading questions answered
- Having trouble with your strategy? Here’s the #1 mistake that traders make
- See how the New Zealand Dollar is viewed by the trading community at the DailyFX Sentiment Page
— Written by Daniel Dubrovsky, Junior Currency Analyst for DailyFX.com
To contact Daniel, use the comments section below or @ddubrovskyFX on Twitter
To receive Daniel‘s analysis directly via email, please SIGN UP HERE