USDJPY Analysis and Talking Points
- USDJPY supported from easing trade war concerns
- Falling trendline resistance from the 2015,2016 and 2017 highs may cap gains
See our Q2 JPY forecast to learn what will drive the oil prices through the quarter.
Impact of Trade Wars click here
Easing Trade War Concerns Support USDJPY
Yesterday, trade talks between the US and China seemingly made great strides to what could potentially turn out to be a trade deal. China had agreed to purchase more US goods as an effort to avoid a trade war, while the US shared their willingness to avert a trade war by placing on hold $150 of tariffs on Chinese imports and the previously announced Chinese steel and aluminium tariffs. In turn, this morning saw the Chinese Finance Ministry state that they will reduce auto import duties effective from July 1st.
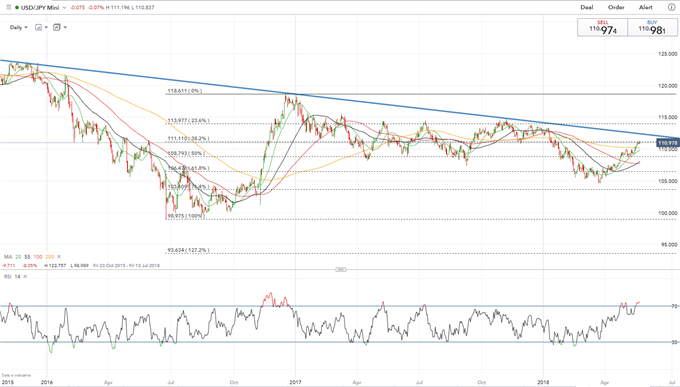
This latest development has helped boost risk sentiment, which in effect has kept USDJPY elevated and continues to hover around the 111.00 handle. As such, increased efforts by either side to increase the likelihood of a trade agreement should see USDJPY continue to press higher for better levels.
Wider US-JP Bond Spreads Favour USDJPY Buying
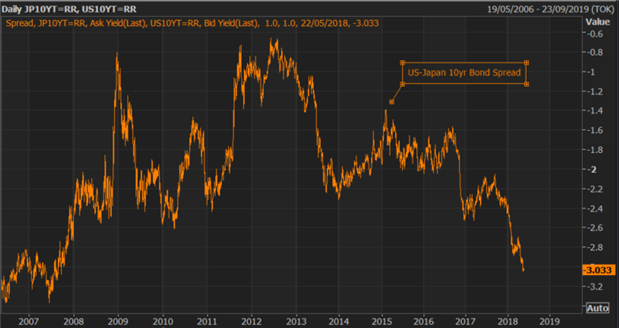
A factor behind the USDJPY appreciation has been the widening of bond spreads between the US and Japan, 10yr spreads currently at its widest since in 2007 at 303bps. This has largely been due to the monetary policy divergence between the BoJ and Fed, the latter seeing expectations being raised for 3 additional rate hikes, while the BoJ remains very expansive with no real signs of a near term exit. Subsequently, continued widening will likely see USDJPY higher, however, if US yields have peaked, this could lead to a potential narrowing of the spread, which will contain further upside in the pair.
IG Client Positioning Sentiment shows that 53.1% of USDJPY traders are net-long. For full client positioning click here

Source: Thomson Reuters
USDJPY PRICE CHART: DAILY TIME FRAME (OCTOBER 2015- MAY 2018)

USDJPY remains contained just below 111.00, while the 38.2% Fibonacci Retracement at 111.11 of the 98.97-118.61 rise also acts as near-term resistance in the pair. Major resistance comes in the form of the falling trendline from the 2015, 2016 and 2017 highs comes in just ahead of the 112.00 level. Relative Strength Indicator resides in overbought territory, which could suggest that USDJPY may see a slight reversal in short term.
— Written by Justin McQueen, Market Analyst
To contact Justin, email him at Justin.mcqueen@ig.com
Follow Justin on Twitter @JMcQueenFX