Talking Points – Japanese Yen, Nikkei 225, Donald Trump, North Korea
- Asian stocks off to a rocky start Thursday, Nikkei 225 falls and Japanese Yen gains
- Donald Trump ordered probe on auto imports, North Korean summit more unlikely
- USD/JPY appears to be turning lower following a warning sign and uptrend break
Build confidence in your own USD/JPY strategy with the help of our free guide!
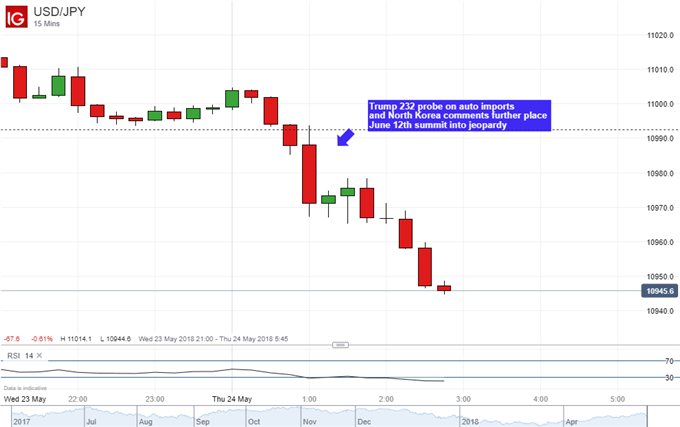
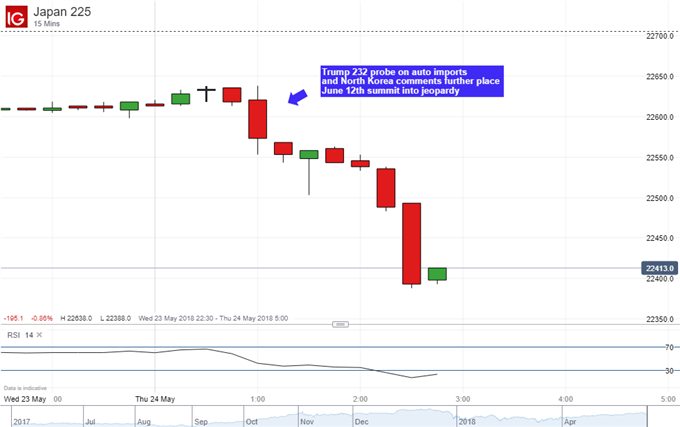
Asian stocks were off to a rocky start on Thursday and the anti-risk Japanese Yen appreciated as US President Donald Trump ordered Commerce Secretary Wilbur Ross to initiate a Section 232 probe on auto imports. This was based on national security grounds. If that sounds familiar, the same reason and process was used to bring the current US aluminum and steel tariffs into place.
As expected, Japanese automotive shares such as Toyota, Honda and Subaru (down as much as 2.19%, 1.01% and 3.15% respectively) tugged down on the Nikkei 225. These automakers are largely responsible for the affordable car segment for not just the US, but the world as a whole. In addition to the risk of potentially denting US auto sales and thus GDP, Trump’s actions also unnerved investors as trade war fears increased.
Check out our history of US/China trade wars infographic which goes over developments from 1900 until the present
Simultaneously, traders were also anxious as Trump’s summit with North Korean Leader Kim Jong Un on June 12th was further placed into jeopardy. Comments from a top North Korean diplomat criticized US Vice President Mike Pence who suggested that NK may end up like the Libyan model. North Korea said that the “nuclear-to-nuclear showdown is entirely dependent upon the decision and behavior of the United States”.
A lack of key economic event risk during the Asian session will probably allow risk trends to continue brewing. Meanwhile, USD/JPY appears to be heading for a reversal.


USD/JPY Technical Analysis: Ready for a Reversal?
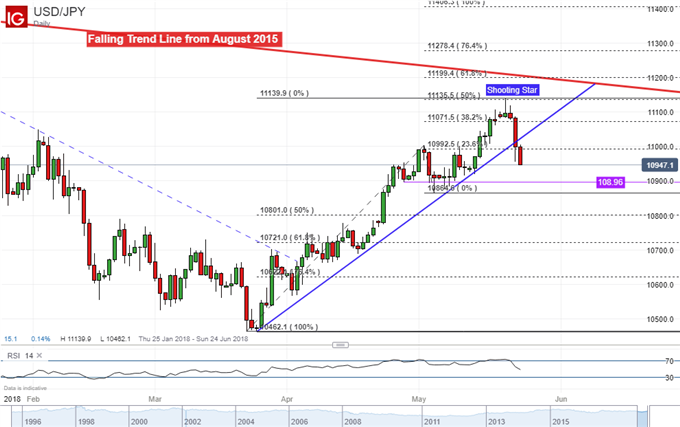
On a daily chart, USD/JPY has closed below a near-term rising trend line from late-March. This followed the emergence of a shooting star candlestick pattern which is a bearish reversal pattern. With that said, confirmation is required and another close below the trend line could signal that the recent dominant trend has ended.
From here, immediate support is 108.96 which is an area the pair struggled to push below in late April and early May. A close below that exposes the May 4th low at 108.64 followed by the 50% midpoint of the Fibonacci retracement at 108.01.
On the other hand, if USD/JPY climbs back, then near-term resistance is the 23.6% extension at 109.92. A Break above that exposes the trend line which may act as for support now resistance.

USD/JPY Trading Resources:
- Join a free Q&A webinar and have your trading questions answered
- Just getting started? See our beginners’ guide for FX traders
- Having trouble with your strategy? Here’s the #1 mistake that traders make
- See how the Japanese Yen is viewed by the trading community at the DailyFX Sentiment Page
— Written by Daniel Dubrovsky, Junior Currency Analyst for DailyFX.com
To contact Daniel, use the comments section below or @ddubrovskyFX on Twitter