
Fundamental Forecast for USOIL: Neutral
Talking Points:
- The ONE Thing:Saudi turning on the spigots may lead to lower prices, but bullish environment remains. OPEC rhetoric is rightly center stage as oil traded notably weaker toward week’s end. Saudi Arabia’s oil minister, Ali-Falih, said he sees a ‘likely’ oil supply boost in H2 2018.
- Per BHI, U.S. Oil Rig Count rises to 859, US total count at 1059
- Crude Oil Price Forecast: Brent Premium Favors OPEC Induced Volatility
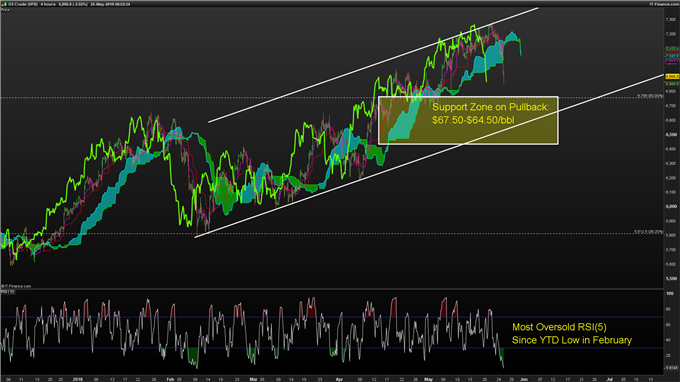
- The technical analysis picture of crude oil shows a sharp pullback off 3-year highs. Chart support comes in for the WTI front-month contract at $67.50/$64.50 per barrel.
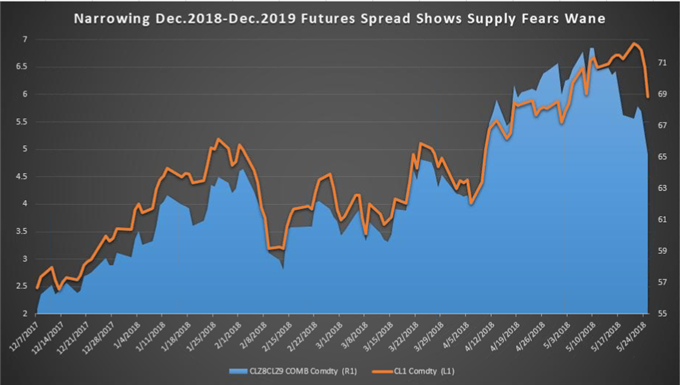
Crude had the first weekly decline for the month of May as OPEC’s comments spooked bulls. More oil coming out of Saudi & Russia is helping to narrow a popular futures calendar spread that helped to visualize the bullish support for crude that weakened this week.
Shortage Fears Wane on OPEC+ Rhetoric

Data source: Bloomberg
Seemingly bearish rhetoric took hold of the Oil market causing the price to fall on Friday. Multiple reports came about OPEC, and their allies that are collectively known as OPEC+ as rolling back production cuts. There remains uncertainty about Venezuelan and Iranian supply that has likely supported these comments from OPEC+.
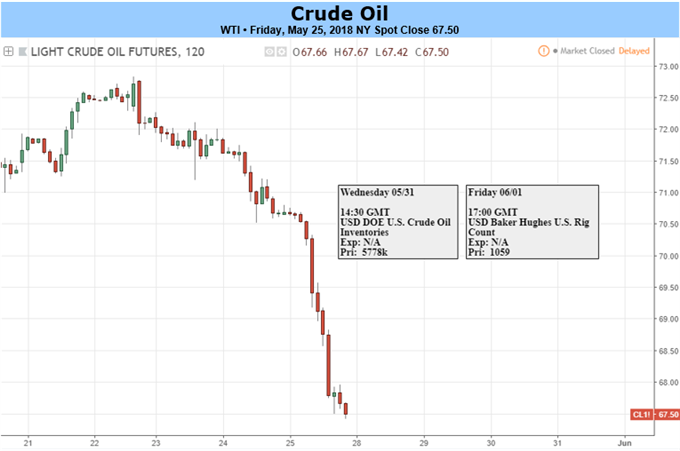
The front-month WTI crude contract broke back below $70 and calendar spreads between December 2018 to December 2019 futures contracts narrowed to the weakest levels in more than a month. The wide spread aligned the move above key resistance levels.
Additionally, owners of oil producer equities are likely not as concerned as an exposed futures traders given that many producers have been locking in high prices through hedging via options.
Crude has nearly erased May’s Gains With ~3.5% Drop Last Week

Data source: Bloomberg. Created by Quasar Elizundia
Once again, WTI and Brent crude has become the market everyone is discussing! Unlock our forecast here
Big Pullback on 240-Minute Chart

Chart Source: Pro Real Time with IG UK Price Feed. Created by Tyler Yell, CMT
The sharp pull-back is seen well with RSI(5) on the four-hour chart. The RSI(5) has hit the lowest point since crude began its impressive ascent from $58/bbl in February to above $72/bbl earlier this week.
Since the news came that Saudi and Russia are considering easing global output cuts, the price dipped aggressively lower. Oil has its first weekly loss for the month on Friday’s nearly 3% loss.
Traders can look to trendline support zone and prior structure support points near $64.50/67.50 as likely support on the pullback. A deeper move below this zone would shift me from neutral to cautiously bearish, but the broader cycle change favoring commodities makes this a difficult view to hold.
Not familiar with Ichimoku? You’re not alone, and you’re in luck. I created a free guide for you here
Next Week’s Data Points That May Affect Energy Markets:
The fundamental focal points for the energy market next week:
- Monday: US Memorial Day
- Monday: Statistics Norway releases quarterly survey on planned investments in the oil industry
- Wednesday (delayed for holiday) 04:30 PM ET: API Weekly Oil Inventories Report
- Thursday (delayed for holiday) 11:00 AM ET: EIA issues weekly US Oil Inventory Report
- Thursday 12-2pm: EIA releases monthly report
- Friday 1:00 PM ET: Baker-Hughes Rig Count
- Friday 3:30 PM ET: Release of the CFTC weekly commitments of traders report on U.S. futures, options contracts
Forex Trading Resources
DailyFX offers a surplus of helpful trading tools, indicators and resources to help traders. For those looking for trading ideas, our IG Client
Sentiment shows the positioning of retail traders with actual live trades and positions.
Our trading guides bring our DailyFX Quarterly Forecasts and our Top Trading Opportunities; and our real-time news feedhas intra-day interactions from the DailyFX team. And if you’re looking for real-time analysis,
our DailyFX Webinars offer numerous sessions each week in which you can see how and why we’re looking at what we’re looking at.
If you’re looking for educational information, our New to FX guide is there to help new(er) traders while our Traits of Successful Traders research is built to help sharpen the skill set by focusing on risk and trade management.
—Written by Tyler Yell, CMT
Tyler Yell is a Chartered Market Technician. Tyler provides Technical
analysis that is powered by fundamental factors on key markets as well as
trading educational resources. Read more of Tyler’s Technical reports via his bio page.
Communicate with Tyler and have your shout below by posting in the comments area. Feel free to include your market views as well.
Discuss this market with Tyler in the live webinar, FX Closing Bell, Weekdays Monday-Thursday at 3 pm ET.
Talk markets on twitter @ForexYell
Join Tyler’s distribution list.
https://www.dailyfx.com/free_guide-tg.html?ref-author=Yell